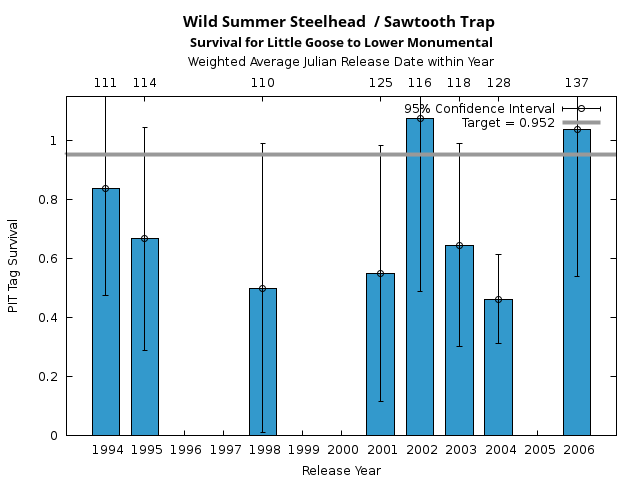
| Release Year | Survival | Standard Error |
Number PIT Tag Groups 1 |
Release Date(s) | Weighted Avg Julian Release Date |
|---|---|---|---|---|---|
| 1994 | 0.8390 | 0.1860 | 1 | 1994-03-15 to 1994-06-08 | 111 (21-apr-1994) |
| 1995 | 0.6670 | 0.1930 | 1 | 1995-03-11 to 1995-05-30 | 114 (24-apr-1995) |
| 1998 | 0.5000 | 0.2500 | 1 | 1998-03-22 to 1998-05-05 | 110 (20-apr-1998) |
| 2001 | 0.5500 | 0.2210 | 1 | 2001-04-14 to 2001-06-30 | 125 (05-may-2001) |
| 2002 | 1.0730 | 0.2980 | 1 | 2002-03-14 to 2002-06-17 | 116 (26-apr-2002) |
| 2003 | 0.6460 | 0.1750 | 1 | 2003-03-19 to 2003-07-11 | 118 (28-apr-2003) |
| 2004 | 0.4630 | 0.0770 | 1 | 2004-03-19 to 2004-10-08 | 128 (07-may-2004) |
| 2006 | 1.0370 | 0.2530 | 1 | 2006-03-24 to 2006-09-25 | 137 (17-may-2006) |
1 For Hatchery releases, a PIT Tag Group is created by pooling PIT Tag releases of the same stock (species, run, and rear type), from the same release location, and released on or near the same day. For Trap releases, a PIT Tag Group is created by pooling PIT Tag releases of the same stock (species, run, and rear type), from the same release location, and released across the whole season due to the sparsity of the release data. Each PIT Tag release (identified by PIT Tag File ID) must meet specific requirements to be included in the group with the intent to obtain a large enough group to estimate survival.
The Survival estimates reported in the table and plotted on the graph may be an average of the estimates calculated for each PIT Tag Group. If the "Number of PIT Tag Groups" in the table row is one (1), then the Survival estimate in the table and plotted on the graph is the estimate calculated for the one group and the 95% Confidence Interval (CI) is calculated using a Z statistic at 1.96. If the "Number of PIT Tag Groups" in the table row is greater than one, then the Survival estimate in the table and plotted on the graph is the arithmetic mean of the Survival estimates for each PIT Tag Group and the 95% CI is calculated using a T statistic with n-1 degrees of freedom and the empirical variance.
Click on the "Details for PIT Tag Groups" link (above) to see the Cormack Jolly-Seber Survival estimates for each group as well as details for each PIT Tag Group composition.
