Click one end of a slider, then adjust with keyboard Left
and Right
arrows
TIP: You may need to resize your browser window or adjust the zoom level to see all the text.
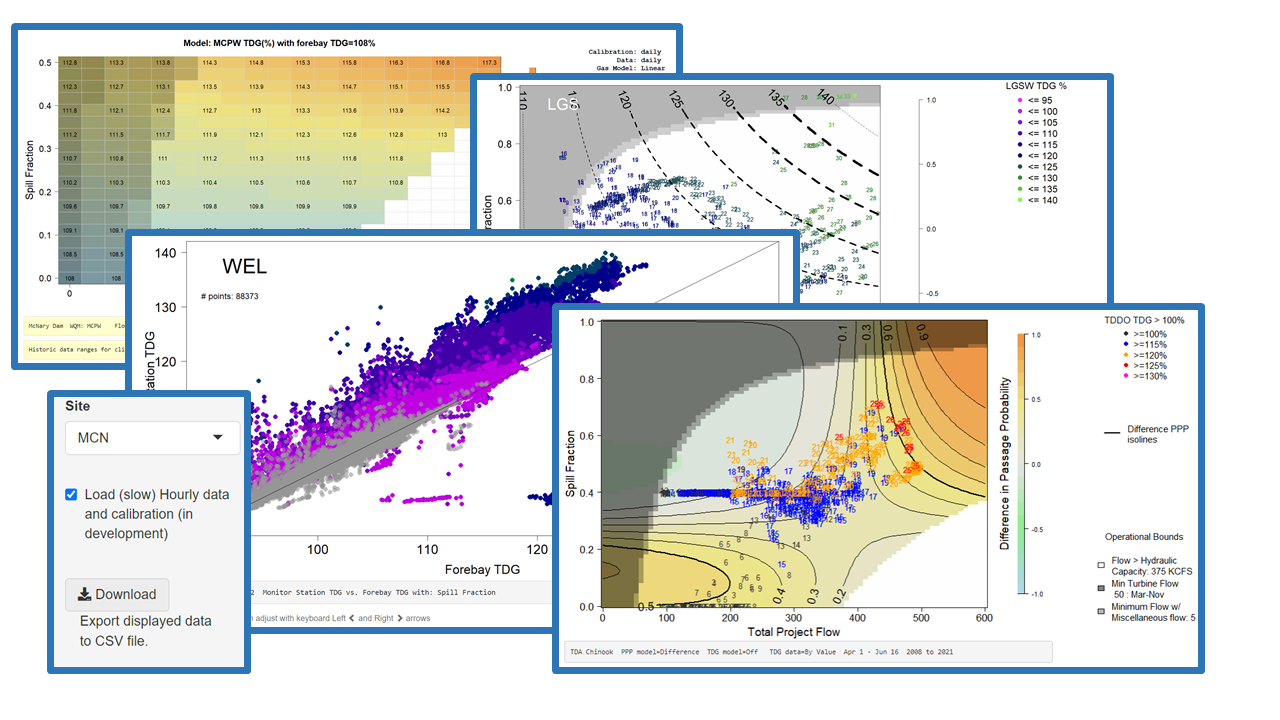
On the plot,
click-and-drag an area to zoom in
and double-click to zoom out
Click one end of a slider, then adjust with keyboard Left
and Right
arrows
TIP: You may need to resize your browser window or adjust the zoom level to see all the text.
Click one end of a slider, then adjust with keyboard Left
and Right
arrows
Columbia Basin Research
School of Aquatic & Fishery Sciences
University of Washington
Questions? Requests? Contact: web@cbr.washington.edu
Supported by Bonneville Power Administration