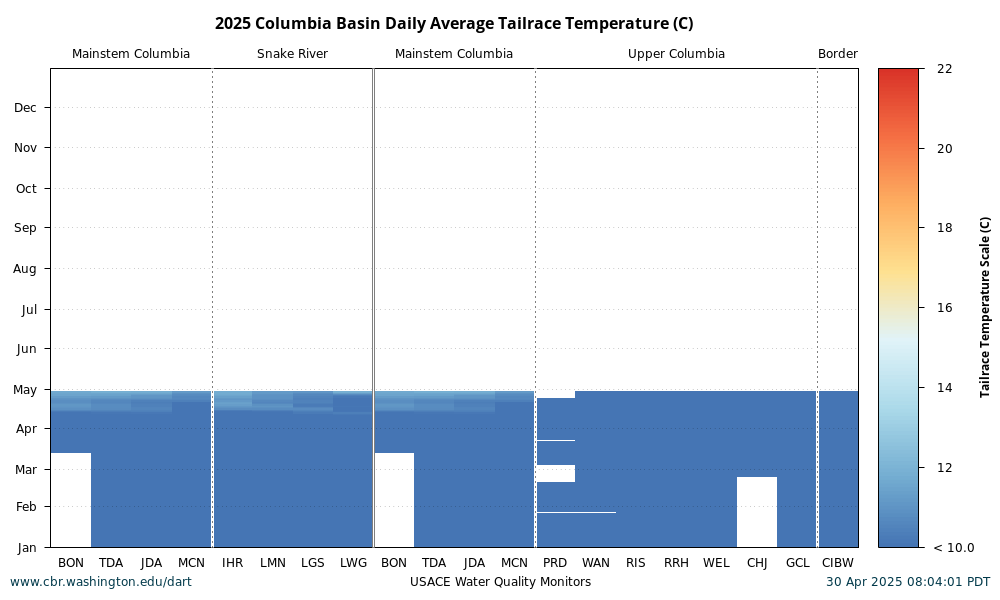
Data Courtesy of U.S. Army Corps of Engineers, NWD and Grant County PUD and Chelan County PUD and Douglas County PUD Columbia Basin Conditions Queries Basin Single Year Basin Year Comparisons Project All Years Project Year Comparisons Select Year, River Data, Value Grouping 2021 2020 2019 2018 2017 2016 2015 2014 2013 2012 2011 2010 2009 2008 2007 2006 2005 2004 2003 2002 2001 2000 1999 1998 1997 1996 1995 Dissolved Gas Percent, Daily Average, Tailrace Dissolved Gas Percent, Rolling Highest 12 Hour Average, Tailrace Outflow KCFS, Daily Average Spill KCFS, Daily Average Spill Percent, Daily Average Temperature C, Daily Average, Forebay Temperature C, 5 Day Average Daily Average, Forebay Temperature C, 7 Day Average Daily Maximum (7DADM), Forebay Temperature C, Daily Average, Tailrace Values Temperature Biologic (9, 16, 18, 20C) Gas Caps (110, 115, 120%) Gas Caps Plus (110, 115, 120, 125%)