
Smolt Passage (PIT Tag) Predictions
Daily Passage Prediction
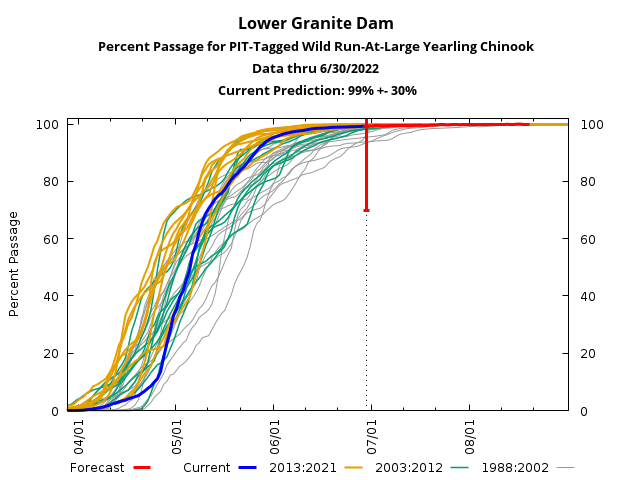
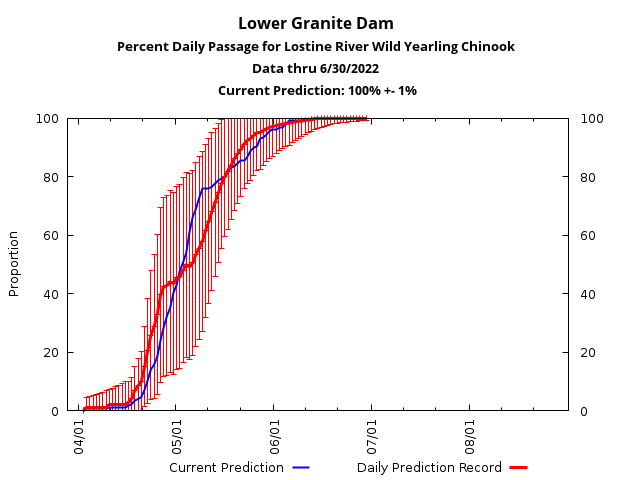
Stock-specific estimates of arrival distributions of Snake River smolts. Percent of stocks arriving at Lower Granite Dam is predicted with the RealTime program based on PIT tag observations and hydrosystem data. Arrivals to the lower dams (Little Goose, Lower Monumental, Ice Harbor and McNary) are predicted with the passage model1. The passage model1 uses projected system operations including flow and spill provided by BPA and predictions of temperature and dissolved gas produced by CBR to provide stock-specific estimates of arrival distributions which take into account the fraction of fish removed from the system by transport and mortality.
Daily Record
RealTime program Daily Record of stock-specific estimates of arrival distributions of Snake River smolts at Lower Granite Dam.
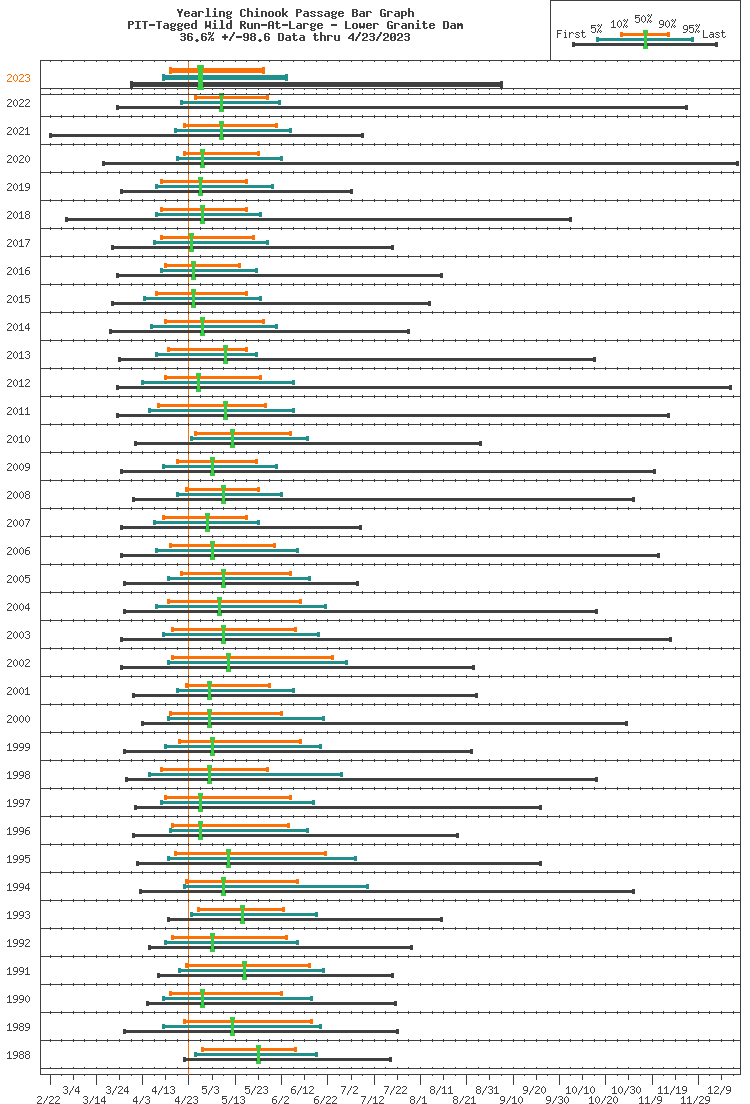
Daily Passage Predictions w/Historical Timing Plots
Historical timing plots and dates of passage at Lower Granite (from PIT-tag data) for the individual streams tracked by program RealTime during the outmigration season. Also known as, "Passage Bar" graphs.
Survival Matrix
Estimate of how many fish survive from one dam to the next. A "survival matrix" shows in-river survival of each stock from any upstream dam to any downstream dam. For example, one can find the expected survival of fish passing Ice Harbor Dam (row: IHR) on any given day to John Day Dam (column: JDA).
| LGS | LMN | IHR | MCN | JDA | TDA | BON | |
| LWG | 0.93 | 0.89 | 0.85 | 0.79 | 0.70 | 0.62 | 0.59 |
| LGS | 0.95 | 0.92 | 0.85 | 0.75 | 0.67 | 0.63 | |
| LMN | 0.96 | 0.90 | 0.79 | 0.70 | 0.67 | ||
| IHR | 0.93 | 0.81 | 0.73 | 0.69 | |||
| MCN | 0.88 | 0.78 | 0.74 | ||||
| JDA | 0.90 | 0.85 | |||||
| TDA | 0.95 |
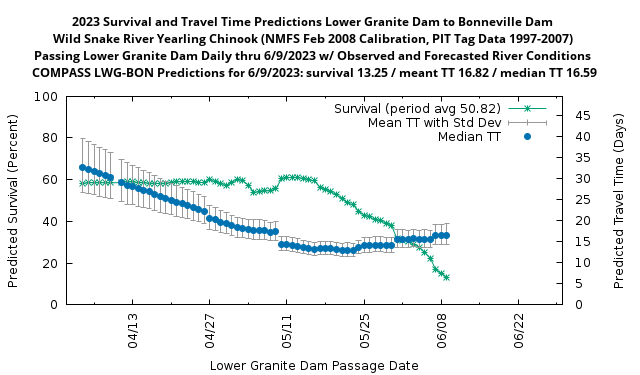
Daily Reach Survival and Travel Time
Historical timing plots and dates of passage at Lower Granite (from PIT-tag data) for the individual streams tracked by program RealTime during the outmigration season.
Smolt Passage (Passage Index) Predictions
Daily Passage Prediction
Species-specific estimates of arrival distributions of Columbia Basin smolts. Percent of stocks arriving at Rock Island, Lower Granite, McNary, John Day, and Bonneville dams is predicted with the RealTime program based on Passage Indices and hydrosystem data.
Daily Record
RealTime program Daily Record of species-specific estimates of arrival distributions of Columbia Basin smolts at Rock Island, Lower Granite, McNary, John Day, and Bonneville dams.
Passage Predictions w/Historical Timing Plots
Historical timing plots and dates of passage at Rock Island, Lower Granite, McNary, John Day, and Bonneville dams for individual species tracked by program RealTime during the outmigration season.
Smolt Passage (Chelan) Predictions
Daily Passage Prediction
Species-specific estimates of arrival distributions of Columbia River smolts. Percent of juvenile salmonids arriving at Rocky Reach Dam is predicted with the RealTime program based on Chelan County PUD passage counts and hydrosystem data.
Daily Record
RealTime program Daily Record of species-specific estimates of arrival distributions of Columbia River smolts at Rocky Reach Dam.
Passage Predictions w/Historical Timing Plots
Historical timing plots and dates of passage at Rocky Reach Dam for individual species tracked by program RealTime during the outmigration season.
Smolt ESU Passage (PIT Tag) Predictions
Daily Passage Prediction
ESU population-specific estimates of arrival distributions of Columbia Basin smolts. Percent of stocks arriving at McNary Dam is predicted with the RealTime program based on PIT tag observations and hydrosystem data. Arrivals to the lower dams (John Day, The Dalles, and Bonneville) are predicted with the passage model1. The passage model1 uses projected system operations including flow and spill provided by BPA and predictions of temperature and dissolved gas produced by CBR to provide ESU population-specific estimates of arrival distributions which take into account the fraction of fish removed from the system by mortality.
Daily Record
RealTime program Daily Record of ESU population-specific estimates of arrival distributions of Columbia Basin smolts at McNary Dam.
Passage Predictions w/Historical Timing Plots
Historical timing plots and dates of passage at McNary (from PIT-tag data) for distinct ESU populations tracked by program RealTime during the outmigration season.
Survival Matrix
Estimate of how many fish survive from one dam to the next. A "survival matrix" shows in-river survival of each stock from any upstream dam to any downstream dam (for example, one can find the expected survival to Bonneville Dam of fish passing McNary Dam on any given day).
Adult Passage Predictions
Daily Passage Prediction
Spring and fall chinook adult passage forecasts for arrival distributions at the Columbia and Snake River dams. The percent of adults arriving at Bonneville Dam is predicted with the Escapement Forecaster based on Adult Passage Counts. The arrivals to the upper dams are predicted with the Adult Upstream Model using the predictions from the Escapement Forecaster as input to the model at Bonneville. The Adult Upstream Model uses projected system operations including flow and spill provided by BPA and predictions of temperature and dissolved gas produced by CBR to produce passage forecasts. Starting with the 2005 migration season, we produce four stock-specific migration timing predictions for Snake River, Upper Columbia River, Lower Columbia River, and Hanford Reach/Yakima.
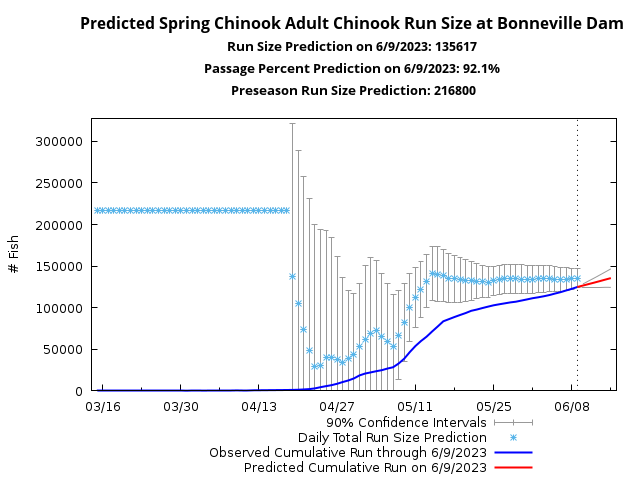
Daily Run Size & Passage (Date-based)
The daily run size and cumulative passage predictions at Bonneville Dam are produced by the Escapement Forecaster. These predictions are derived from a preseason forecast, current observed adult passage data (courtesy of U.S. Army Corps of Engineers, NWD) and historic run timing using an optimal pattern matching routine. Since 2005, the June 15 cutoff date for the spring migration has been used to best match the estimate and run dates used by the Technical Advisory Committee. The intention is to include Snake River summer Chinook with the Upriver Spring Chinook run.
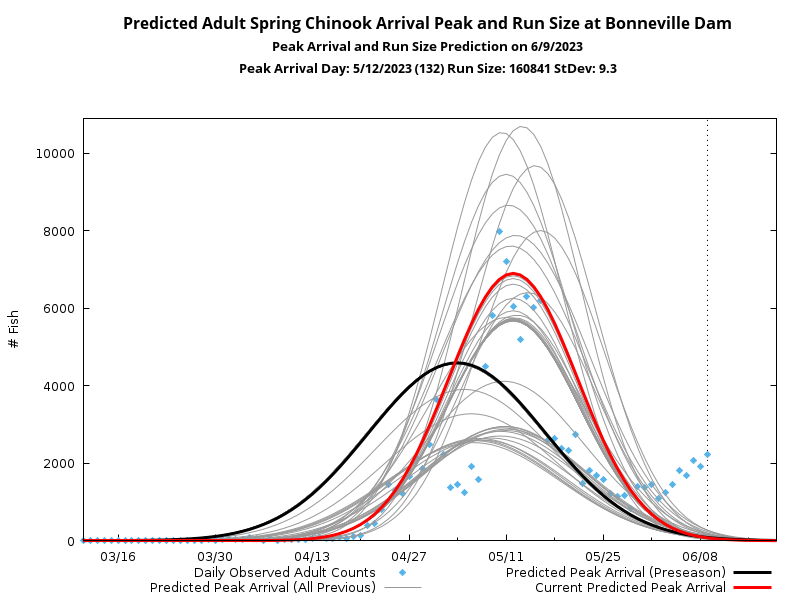
Peak Arriving Timing & Run Size
The peak arrival day and run size predictions at Bonneville Dam. These predictions for spring Chinook begin with a preseason prediction of run timing from a Genetics and Environment Timing model, and a preseason run-size prediction. Because the complete run of Chinook in the Columbia River is the sum of three sub-runs (spring, summer and fall each well characterized by a gaussian distribution), inseason forecasts use daily observations to adjust the parameters that comprise the first mode of the complete distribution to predict the spring Chinook run. Please refer to Run timing of adult Chinook salmon passing Bonneville Dam on the Columbia River. A manuscript detailing the Genetics and Environment Timing model was published in 2009.
Anderson JJ, Beer WN. Oceanic, riverine, and genetic influences on spring chinook salmon migration timing. Ecological Applications [Internet]. 2009;19:1989-2003. Available from: http://dx.doi.org/10.1890/08-0477.1
Water Quality Predictions
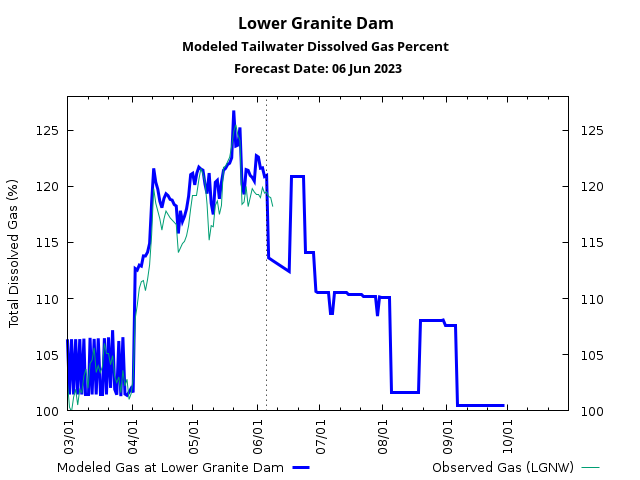
Total Dissolved Gas Forecasts
Total Dissolved Gas forecasts with observed data for 15 major dams along the Snake, Mid-Columbia and Lower Columbia River. The TDG forecasts are produced by the passage model1 based on historical data, year-to-date observed data, temperature forecasts, projected system operations including flow and spill provided by BPA, and calibrated gas models for each dam.
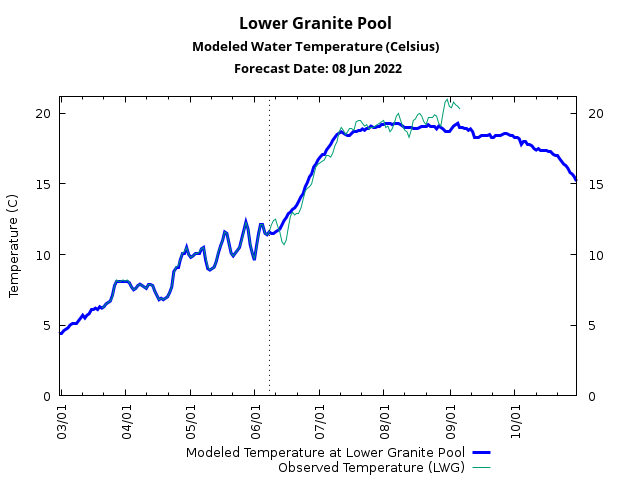
Temperature Forecasts
Temperature forecasts with observed data for the major reservoirs along the Snake, Mid-Columbia and Lower Columbia River.
Inseason Forecasts Methods and Information
Provides information about parameters used by the models and programs to provide estimates of arrival distributions for the distinct stocks and species at the Columbia Basin dams. Includes critical parameters used by passage model1 when generating predictions for the downstream dams.
Inseason Forecasts Post Season Analysis and Other Publications
Includes post-season evaluations of the performance of RealTime Program juvenile migration forecasts, passage model1 with RealTime Program juvenile migration forecasts, Adult Upstream Model migration forecasts, and additional technical documentation.
Notes
1 From 1996-2006, CRiSP was the passage model used for juvenile migration forecasts and water quality forecasts. In 2007, the Comprehensive Passage (COMPASS) model was implemented. Please refer to Smolt Passage Inseason Forecasts section of Methods for more information.