
Columbia Basin Performance Measures River Conditions and Fish Exposure at Hydroelectric Projects
To get started with Observed Fish Exposure, Observed River Conditions, or Forecasted Fish Exposure, make selections from the individual category menus and click the associated "Go to Query" button.
Resources
Notes
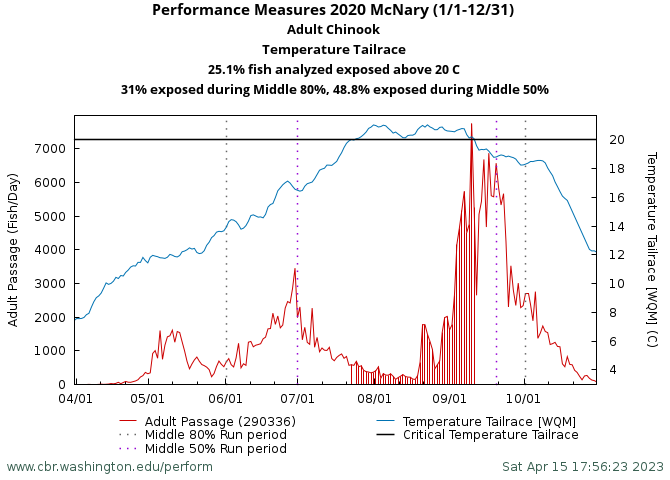
The Columbia Basin Performance Measures online data analysis tool calculates observed Fish Exposure to River Conditions at the major hydroelectric projects on the Columbia and Snake Rivers.
Exposure graphs and summary tables are based on observed data retrieved from the Columbia River Data Access in Real Time (DART) database. Fish exposure is based on the total number of fish passing a selected project under user-specified hydrological conditions. Summary tables include statistics for the total run period and the middle 80% of the run period.
Available Observed River Conditions are: Dissolved Gas Percent, Dissolved Gas Percent Highest 12hr, Dissolved Gas Percent Highest Running 12hr, Dissolved Gas Percent 12hr Day, Dissolved Gas Percent 12hr Night, Outflow, Spill, Spill Percent, Spill 12hr Day, Spill 12hr Night, Temperature, Temperature 7DADM, and Turbidity
The Forecasted Exposures are based on our Inseason Forecasts for both fish passage and hydrosystem conditions (Dissolved Gas Percent and Temperature). Exposure is based on the forecasted percent of fish passing a selected project under user-specified hydrological conditions.