
Alert: Sacramento River Weirs Overtopping
Data Courtesy of CDEC; Forecast Data Courtesy of National Water Prediction Service (NWPS)
| Weir | NWPS Forecast 07/02 |
NWPS Forecast 07/01 |
NWPS Forecast 06/30 |
NWPS Forecast 06/29 |
Today Peak | Today Hour | 06/27 | 06/26 | 06/25 | 06/24 | 06/23 | 06/22 | 06/21 | 06/20 | 06/19 | 06/18 |
|---|---|---|---|---|---|---|---|---|---|---|---|---|---|---|---|---|
| MLW | < -0.50 | < -0.50 | < -0.50 | < -0.50 | < -0.50 | < -0.50 | < -0.50 | < -0.50 | < -0.50 | < -0.50 | < -0.50 | < -0.50 | < -0.50 | < -0.50 | ||
| CLW | < -0.50 | < -0.50 | < -0.50 | < -0.50 | 0800 | < -0.50 | < -0.50 | < -0.50 | < -0.50 | < -0.50 | < -0.50 | < -0.50 | < -0.50 | < -0.50 | < -0.50 |
|
| TIS | < -0.50 | < -0.50 | < -0.50 | < -0.50 | < -0.50 | < -0.50 | < -0.50 | < -0.50 | < -0.50 | < -0.50 | < -0.50 | < -0.50 | < -0.50 | < -0.50 | ||
| FRE | -16.30 | -16.69 | -17.06 | -17.19 | -17.13 | 0000 | -17.08 | -16.89 | -16.67 | -16.56 |
-16.69 | -16.86 | -16.99 | -17.13 | -17.37 | -17.61 |
Water Year 2026 Daily Average River Stage
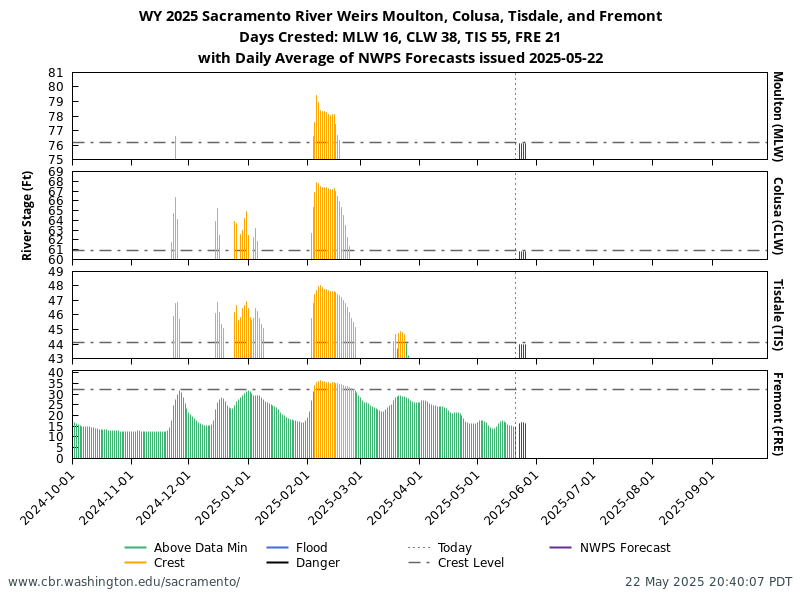
| Weir | Moulton Weir (MLW) | Colusa Weir (CLW) | Tisdale Weir (TIS) | Fremont Weir (FRE) |
|---|---|---|---|---|
| River Stage Levels |
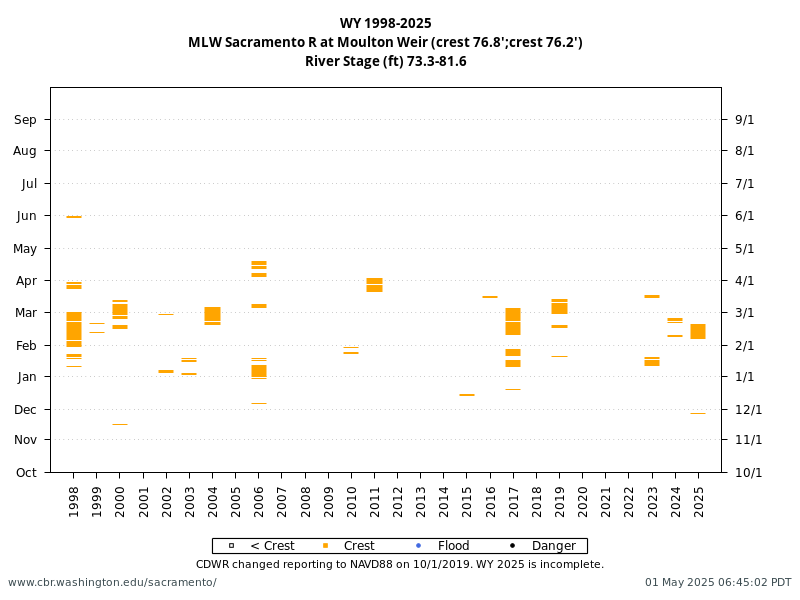
Minimum: 75.7
Crest: 76.2 Flood: 83.8 Danger: 84.8 Datum: NAVD88 |
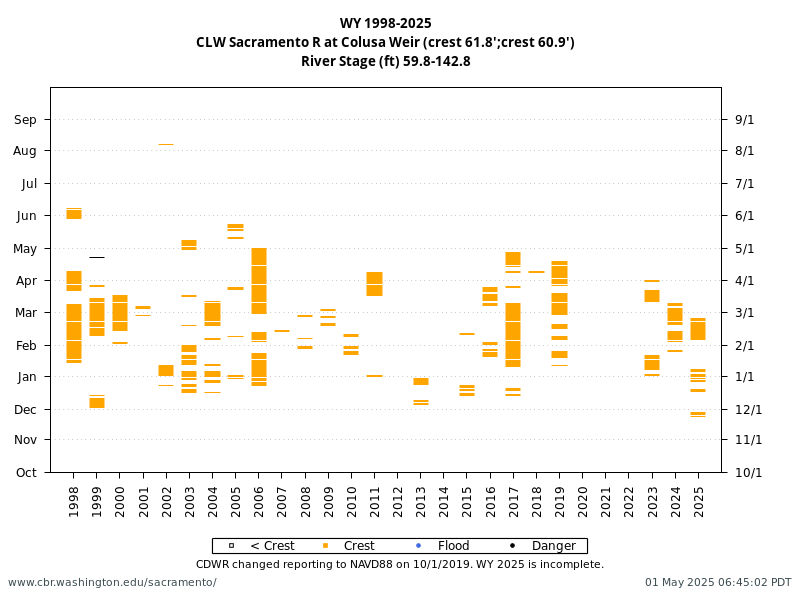
Minimum: 60.4
Crest: 60.9 Flood: 70.1 Danger: 71.1 Datum: NAVD88 |
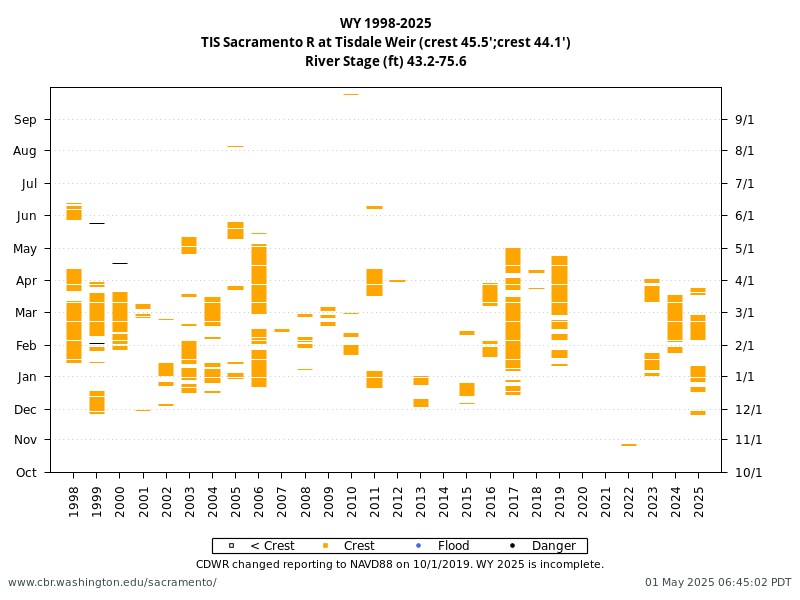
Minimum: 43.6
Crest: 44.1 Flood: 51.6 Danger: 52.6 Datum: NAVD88 |
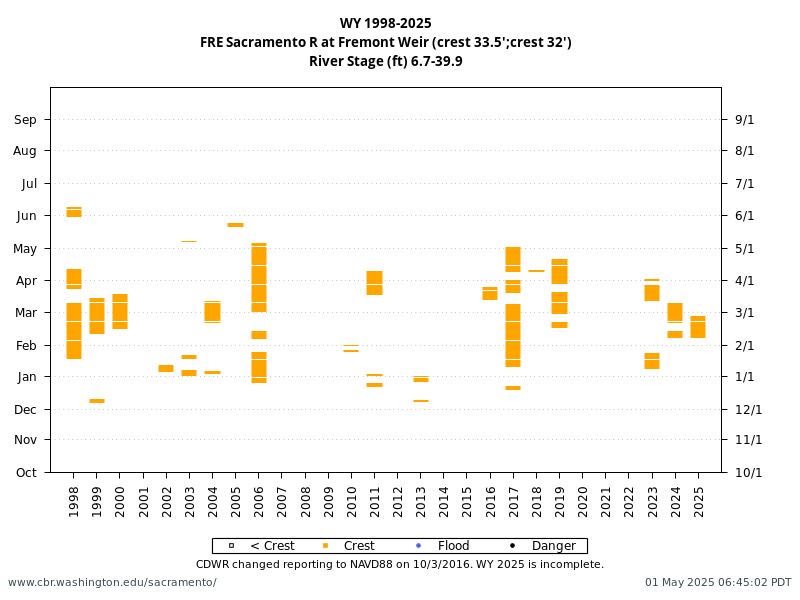
Minimum: NA
Crest: 32.0 Flood: 39.5 Danger: 40.5 Datum: NAVD88 |
| Summary for 06/18/2026 - 06/27/2026 |
Peak: Below Minimum Crest: 0 Days Flood: 0 Days Danger: 0 Days |
Peak: 59.66 on 2026-06-18 Crest: 0 Days Flood: 0 Days Danger: 0 Days |
Peak: Below Minimum Crest: 0 Days Flood: 0 Days Danger: 0 Days |
Peak: 15.44 on 2026-06-24 Crest: 0 Days Flood: 0 Days Danger: 0 Days |
| Site History Last Date |
Over Crest: 2026-02-27 Over Flood: Over Danger: |
Over Crest: 2026-02-28 Over Flood: 1999-04-22 Over Danger: |
Over Crest: 2026-03-04 Over Flood: 2000-04-15 Over Danger: 1999-05-24 |
Over Crest: 2026-03-03 Over Flood: 1997-01-04 Over Danger: 1984-08-21 |
| National Water Prediction Service | River Forecast at Moulton | River Forecast at Colusa | River Forecast at Tisdale | River Forecast at Fremont |
| California Nevada River Forecast Center River Forecast | River Forecast at Moulton | River Forecast at Colusa | River Forecast at Tisdale | River Forecast at Fremont |
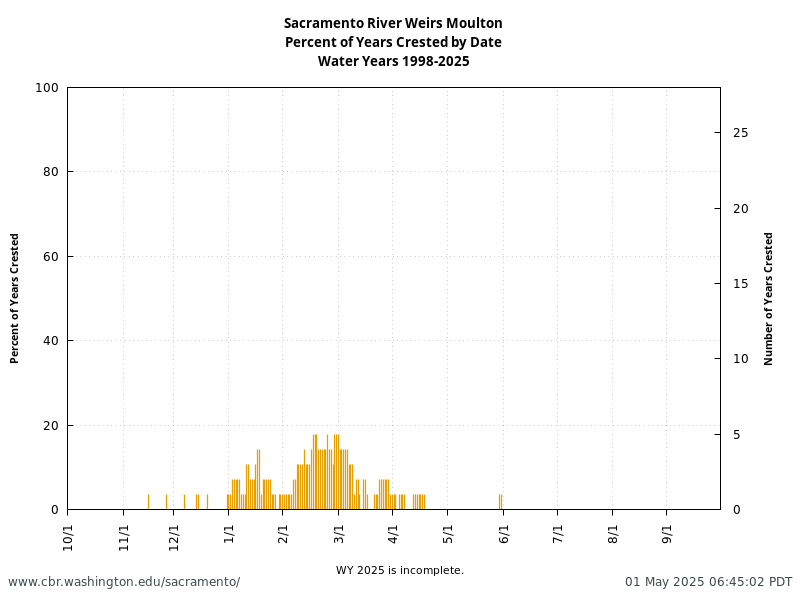
| WY2026 | Moulton Weir MLW Minimum: 75.7 Crest: 76.2 Datum: NAVD88 |
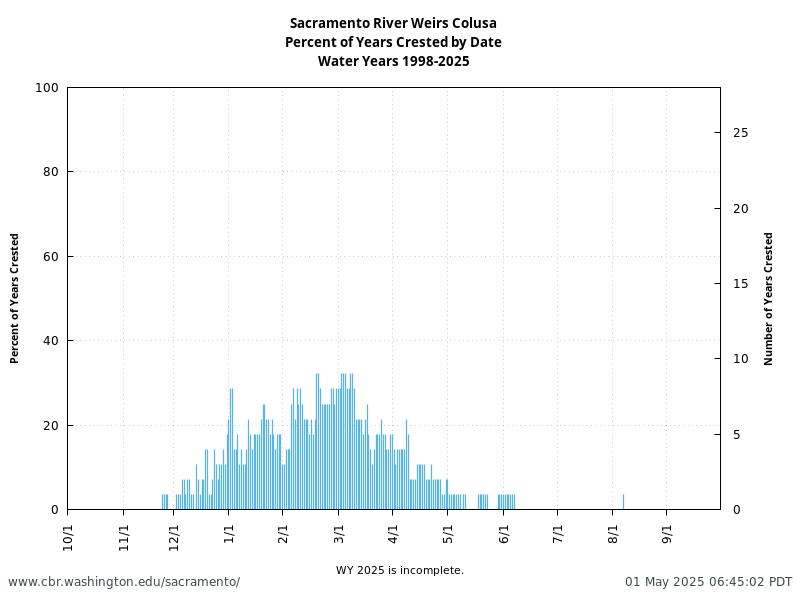
Colusa Weir CLW Minimum: 60.4 Crest: 60.9 Datum: NAVD88 |
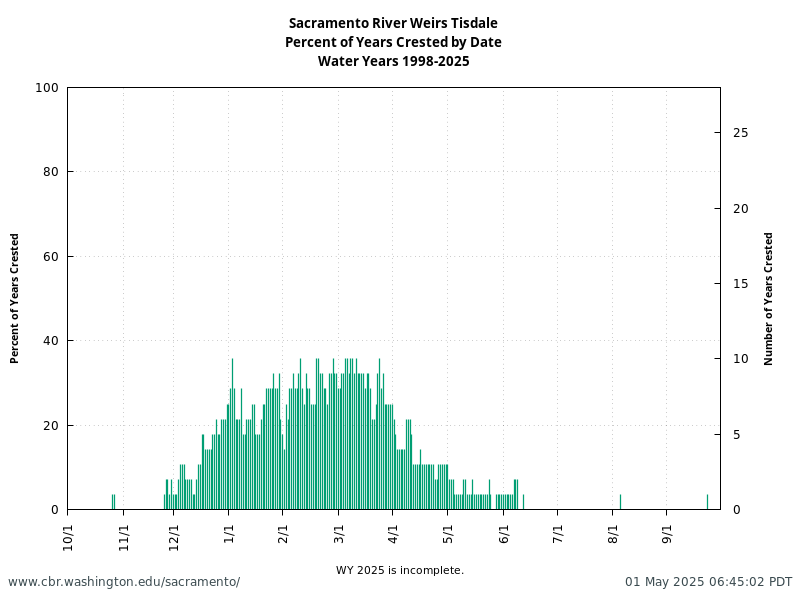
Tisdale Weir TIS Minimum: 43.6 Crest: 44.1 Datum: NAVD88 |
Fremont Weir FRE Minimum: NA Crest: 32.0 Datum: NAVD88 |
||||||||
|---|---|---|---|---|---|---|---|---|---|---|---|---|
| Daily Avg | Ft above Crest | Ft above/ below Flood |
Daily Avg | Ft above Crest | Ft above/ below Flood |
Daily Avg | Ft above Crest | Ft above/ below Flood |
Daily Avg | Ft above Crest | Ft above/ below Flood |
|
| NWPS Forecast 2026-07-02 | 76.10 | 60.80 | 44.00 | 15.70 | ||||||||
| NWPS Forecast 2026-07-01 | 76.10 | 60.80 | 44.00 | 15.31 | ||||||||
| NWPS Forecast 2026-06-30 | 76.10 | 60.80 | 44.00 | 14.94 | ||||||||
| NWPS Forecast 2026-06-29 | 76.10 | 60.80 | 44.00 | 14.81 | ||||||||
| 2026-06-27 | 59.62 | 14.92 | ||||||||||
| 2026-06-26 | 59.62 | 15.11 | ||||||||||
| 2026-06-25 | 59.63 | 15.33 | ||||||||||
| 2026-06-24 | 59.63 | 15.44 | ||||||||||
| 2026-06-23 | 59.64 | 15.31 | ||||||||||
| 2026-06-22 | 59.64 | 15.14 | ||||||||||
| 2026-06-21 | 59.64 | 15.01 | ||||||||||
| 2026-06-20 | 59.65 | 14.87 | ||||||||||
| 2026-06-19 | 59.65 | 14.63 | ||||||||||
| 2026-06-18 | 59.66 | 14.39 | ||||||||||
| 2026-06-17 | 59.66 | 14.29 | ||||||||||
| 2026-06-16 | 59.66 | 14.36 | ||||||||||
| 2026-06-15 | 59.66 | 14.41 | ||||||||||
| 2026-06-14 | 59.67 | 14.45 | ||||||||||
| 2026-06-13 | 59.67 | 14.69 | ||||||||||
| 2026-06-12 | 59.67 | 14.88 | ||||||||||
| 2026-06-11 | 59.67 | 14.98 | ||||||||||
| 2026-06-10 | 59.68 | 15.00 | ||||||||||
| 2026-06-09 | 59.68 | 15.06 | ||||||||||
| 2026-06-08 | 59.68 | 15.22 | ||||||||||
| 2026-06-07 | 59.69 | 15.26 | ||||||||||
| 2026-06-06 | 59.69 | 15.36 | ||||||||||
| 2026-06-05 | 59.69 | 15.62 | ||||||||||
| 2026-06-04 | 59.70 | 15.83 | ||||||||||
| 2026-06-03 | 59.70 | 16.03 | ||||||||||
| 2026-06-02 | 59.70 | 16.23 | ||||||||||
| 2026-06-01 | 59.70 | 16.27 | ||||||||||
| 2026-05-31 | 59.70 | 15.89 | ||||||||||
| 2026-05-30 | 59.71 | 15.24 | ||||||||||
| 2026-05-29 | 59.71 | 14.52 | ||||||||||
| 2026-05-28 | 59.71 | 13.99 | ||||||||||
| 2026-05-27 | 59.72 | 13.64 | ||||||||||
| 2026-05-26 | 59.72 | 13.14 | ||||||||||
| 2026-05-25 | 59.72 | 12.47 | ||||||||||
| 2026-05-24 | 59.73 | 12.07 | ||||||||||
| 2026-05-23 | 59.73 | 12.13 | ||||||||||
| 2026-05-22 | 59.73 | 12.14 | ||||||||||
| 2026-05-21 | 59.73 | 12.26 | ||||||||||
| 2026-05-20 | 59.73 | 12.90 | ||||||||||
| 2026-05-19 | 59.74 | 13.45 | ||||||||||
| 2026-05-18 | 59.74 | 13.57 | ||||||||||
| 2026-05-17 | 59.74 | 13.33 | ||||||||||
| 2026-05-16 | 59.75 | 13.06 | ||||||||||
| 2026-05-15 | 59.75 | 12.95 | ||||||||||
| 2026-05-14 | 59.75 | 13.07 | ||||||||||
| 2026-05-13 | 59.76 | 13.54 | ||||||||||
| 2026-05-12 | 59.76 | 14.12 | ||||||||||
| 2026-05-11 | 59.76 | 14.36 | ||||||||||
| 2026-05-10 | 59.76 | 14.60 | ||||||||||
| 2026-05-09 | 59.76 | 14.72 | ||||||||||
| 2026-05-08 | 59.76 | 14.77 | ||||||||||
| 2026-05-07 | 59.76 | 14.59 | ||||||||||
| 2026-05-06 | 59.76 | 14.51 | ||||||||||
| 2026-05-05 | 59.77 | 14.47 | ||||||||||
| 2026-05-04 | 59.77 | 14.78 | ||||||||||
| 2026-05-03 | 59.77 | 15.32 | ||||||||||
| 2026-05-02 | 59.77 | 16.04 | ||||||||||
| 2026-05-01 | 59.77 | 16.66 | ||||||||||
| 2026-04-30 | 59.77 | 17.26 | ||||||||||
| 2026-04-29 | 59.78 | 17.77 | ||||||||||
| 2026-04-28 | 59.78 | 18.34 | ||||||||||
| 2026-04-27 | 59.78 | 42.98 | 18.98 | |||||||||
| 2026-04-26 | 59.78 | 42.98 | 19.59 | |||||||||
| 2026-04-25 | 59.78 | 42.98 | 20.62 | |||||||||
| 2026-04-24 | 59.79 | 42.98 | 21.72 | |||||||||
| 2026-04-23 | 59.79 | 42.99 | 21.24 | |||||||||
| 2026-04-22 | 59.79 | 42.98 | 19.02 | |||||||||
| 2026-04-21 | 59.79 | 42.98 | 17.93 | |||||||||
| 2026-04-20 | 59.80 | 42.98 | 17.81 | |||||||||
| 2026-04-19 | 59.80 | 42.98 | 18.27 | |||||||||
| 2026-04-18 | 59.80 | 42.98 | 18.88 | |||||||||
| 2026-04-17 | 59.80 | 42.99 | 19.77 | |||||||||
| 2026-04-16 | 59.81 | 42.99 | 20.70 | |||||||||
| 2026-04-15 | 59.81 | 42.98 | 21.85 | |||||||||
| 2026-04-14 | 59.81 | 42.98 | 22.59 | |||||||||
| 2026-04-13 | 59.82 | 42.98 | 22.10 | |||||||||
| 2026-04-12 | 59.82 | 42.98 | 19.74 | |||||||||
| 2026-04-11 | 59.82 | 42.98 | 17.22 | |||||||||
| 2026-04-10 | 59.82 | 42.98 | 15.28 | |||||||||
| 2026-04-09 | 59.82 | 42.98 | 14.40 | |||||||||
| 2026-04-08 | 59.82 | 42.98 | 14.50 | |||||||||
| 2026-04-07 | 59.83 | 42.98 | 14.75 | |||||||||
| 2026-04-06 | 59.83 | 42.98 | 15.05 | |||||||||
| 2026-04-05 | 59.83 | 42.98 | 15.58 | |||||||||
| 2026-04-04 | 59.83 | 42.98 | 16.01 | |||||||||
| 2026-04-03 | 59.84 | 42.99 | 15.67 | |||||||||
| 2026-04-02 | 59.84 | 42.99 | 14.93 | |||||||||
| 2026-04-01 | 59.84 | 42.98 | 14.84 | |||||||||
| 2026-03-31 | 59.84 | 42.98 | 14.92 | |||||||||
| 2026-03-30 | 59.84 | 42.98 | 15.00 | |||||||||
| 2026-03-29 | 59.84 | 42.98 | 15.08 | |||||||||
| 2026-03-28 | 59.84 | 42.98 | 15.14 | |||||||||
| 2026-03-27 | 59.85 | 42.99 | 15.39 | |||||||||
| 2026-03-26 | 59.85 | 42.99 | 15.74 | |||||||||
| 2026-03-25 | 59.85 | 42.98 | 16.41 | |||||||||
| 2026-03-24 | 59.85 | 42.98 | 16.91 | |||||||||
| 2026-03-23 | 59.85 | 42.98 | 17.14 | |||||||||
| 2026-03-22 | 59.86 | 42.98 | 17.30 | |||||||||
| 2026-03-21 | 59.86 | 42.98 | 17.55 | |||||||||
| 2026-03-20 | 59.86 | 42.98 | 17.90 | |||||||||
| 2026-03-19 | 59.86 | 42.98 | 18.25 | |||||||||
| 2026-03-18 | 59.86 | 42.98 | 18.78 | |||||||||
| 2026-03-17 | 59.86 | 42.99 | 19.33 | |||||||||
| 2026-03-16 | 59.86 | 42.98 | 19.68 | |||||||||
| 2026-03-15 | 59.86 | 42.99 | 19.97 | |||||||||
| 2026-03-14 | 59.86 | 42.98 | 20.30 | |||||||||
| 2026-03-13 | 59.86 | 42.98 | 20.92 | |||||||||
| 2026-03-12 | 59.87 | 42.98 | 21.95 | |||||||||
| 2026-03-11 | 59.87 | 42.98 | 23.09 | |||||||||
| 2026-03-10 | 59.87 | 42.98 | 24.03 | |||||||||
| 2026-03-09 | 59.87 | 42.98 | 24.81 | |||||||||
| 2026-03-08 | 59.87 | 42.98 | 25.79 | |||||||||
| 2026-03-07 | 59.87 | 42.99 | 27.00 | |||||||||
| 2026-03-06 | 59.87 | 42.99 | 28.48 | |||||||||
| 2026-03-05 | 59.88 | 43.06 | 30.02 | |||||||||
| 2026-03-04 | 59.88 | 44.12 | 0.02 | -7.49 | 31.30 | |||||||
| 2026-03-03 | 59.88 | 44.89 | 0.79 | -6.71 | 32.27 | 0.27 | -7.23 | |||||
| 2026-03-02 | 59.88 | 45.46 | 1.36 | -6.14 | 32.85 | 0.85 | -6.65 | |||||
| 2026-03-01 | 60.69 | 46.17 | 2.07 | -5.43 | 33.23 | 1.23 | -6.27 | |||||
| 2026-02-28 | 63.78 | 2.88 | -6.32 | 46.92 | 2.82 | -4.68 | 33.34 | 1.34 | -6.16 | |||
| 2026-02-27 | 76.93 | 0.73 | -6.87 | 66.63 | 5.73 | -3.47 | 47.37 | 3.27 | -4.23 | 32.20 | 0.20 | -7.30 |
| 2026-02-26 | 76.85 | 0.65 | -6.95 | 65.99 | 5.09 | -4.12 | 46.95 | 2.85 | -4.65 | 29.89 | ||
| 2026-02-25 | 60.91 | 0.01 | -9.19 | 45.12 | 1.02 | -6.48 | 27.12 | |||||
| 2026-02-24 | 59.81 | 27.20 | ||||||||||
| 2026-02-23 | 59.81 | 28.31 | ||||||||||
| 2026-02-22 | 59.81 | 44.09 | 29.20 | |||||||||
| 2026-02-21 | 59.82 | 45.33 | 1.23 | -6.27 | 28.96 | |||||||
| 2026-02-20 | 59.82 | 44.85 | 0.75 | -6.75 | 28.32 | |||||||
| 2026-02-19 | 59.82 | 44.69 | 0.59 | -6.91 | 28.23 | |||||||
| 2026-02-18 | 59.82 | 45.20 | 1.10 | -6.40 | 27.76 | |||||||
| 2026-02-17 | 59.82 | 44.83 | 0.73 | -6.77 | 24.57 | |||||||
| 2026-02-16 | 59.82 | 22.73 | ||||||||||
| 2026-02-15 | 59.83 | 23.35 | ||||||||||
| 2026-02-14 | 59.83 | 23.85 | ||||||||||
| 2026-02-13 | 59.83 | 23.46 | ||||||||||
| 2026-02-12 | 59.83 | 22.36 | ||||||||||
| 2026-02-11 | 59.83 | 22.13 | ||||||||||
| 2026-02-10 | 59.83 | 21.89 | ||||||||||
| 2026-02-09 | 59.83 | 21.58 | ||||||||||
| 2026-02-08 | 59.84 | 21.48 | ||||||||||
| 2026-02-07 | 59.84 | 21.60 | ||||||||||
| 2026-02-06 | 59.84 | 21.63 | ||||||||||
| 2026-02-05 | 59.84 | 21.49 | ||||||||||
| 2026-02-04 | 59.84 | 21.61 | ||||||||||
| 2026-02-03 | 59.84 | 21.75 | ||||||||||
| 2026-02-02 | 59.84 | 21.70 | ||||||||||
| 2026-02-01 | 59.85 | 21.32 | ||||||||||
| 2026-01-31 | 59.85 | 19.92 | ||||||||||
| 2026-01-30 | 59.85 | 19.43 | ||||||||||
| 2026-01-29 | 59.85 | 19.98 | ||||||||||
| 2026-01-28 | 59.86 | 20.68 | ||||||||||
| 2026-01-27 | 59.86 | 21.48 | ||||||||||
| 2026-01-26 | 59.86 | 22.33 | ||||||||||
| 2026-01-25 | 59.86 | 23.13 | ||||||||||
| 2026-01-24 | 59.86 | 23.90 | ||||||||||
| 2026-01-23 | 59.87 | 43.29 | 24.49 | |||||||||
| 2026-01-22 | 59.87 | 43.62 | 24.90 | |||||||||
| 2026-01-21 | 59.87 | 43.90 | 25.32 | |||||||||
| 2026-01-20 | 59.87 | 44.04 | 25.82 | |||||||||
| 2026-01-19 | 59.87 | 44.17 | 0.07 | -7.43 | 26.40 | |||||||
| 2026-01-18 | 59.88 | 44.35 | 0.25 | -7.25 | 27.02 | |||||||
| 2026-01-17 | 59.88 | 44.61 | 0.51 | -6.99 | 27.74 | |||||||
| 2026-01-16 | 59.88 | 44.90 | 0.80 | -6.70 | 28.49 | |||||||
| 2026-01-15 | 59.88 | 45.15 | 1.05 | -6.45 | 29.40 | |||||||
| 2026-01-14 | 59.88 | 45.41 | 1.31 | -6.19 | 30.50 | |||||||
| 2026-01-13 | 59.89 | 45.69 | 1.59 | -5.91 | 31.65 | |||||||
| 2026-01-12 | 60.20 | 45.96 | 1.86 | -5.64 | 32.62 | 0.62 | -6.88 | |||||
| 2026-01-11 | 61.28 | 0.38 | -8.82 | 46.26 | 2.16 | -5.34 | 33.16 | 1.16 | -6.34 | |||
| 2026-01-10 | 62.53 | 1.63 | -7.57 | 46.55 | 2.45 | -5.05 | 33.58 | 1.58 | -5.92 | |||
| 2026-01-09 | 64.07 | 3.17 | -6.03 | 46.92 | 2.82 | -4.68 | 33.99 | 1.99 | -5.51 | |||
| 2026-01-08 | 76.68 | 0.48 | -7.12 | 66.08 | 5.18 | -4.02 | 47.40 | 3.30 | -4.20 | 34.18 | 2.18 | -5.32 |
| 2026-01-07 | 77.07 | 0.87 | -6.73 | 66.73 | 5.83 | -3.37 | 47.41 | 3.31 | -4.19 | 34.26 | 2.26 | -5.24 |
| 2026-01-06 | 76.51 | 0.31 | -7.29 | 65.73 | 4.83 | -4.37 | 47.14 | 3.04 | -4.46 | 34.32 | 2.32 | -5.18 |
| 2026-01-05 | 65.65 | 4.75 | -4.45 | 47.13 | 3.03 | -4.47 | 33.96 | 1.96 | -5.54 | |||
| 2026-01-04 | 65.15 | 4.25 | -4.95 | 46.84 | 2.74 | -4.76 | 32.78 | 0.78 | -6.72 | |||
| 2026-01-03 | 62.78 | 1.88 | -7.32 | 46.17 | 2.07 | -5.43 | 30.47 | |||||
| 2026-01-02 | 59.94 | 44.75 | 0.65 | -6.85 | 29.12 | |||||||
| 2026-01-01 | 59.88 | 44.54 | 0.44 | -7.06 | 30.02 | |||||||
| 2025-12-31 | 59.88 | 45.14 | 1.04 | -6.46 | 31.76 | |||||||
| 2025-12-30 | 59.89 | 45.60 | 1.50 | -6.00 | 33.00 | 1.00 | -6.50 | |||||
| 2025-12-29 | 62.38 | 1.48 | -7.72 | 46.56 | 2.46 | -5.04 | 33.57 | 1.57 | -5.93 | |||
| 2025-12-28 | 65.49 | 4.59 | -4.61 | 47.11 | 3.01 | -4.49 | 33.78 | 1.78 | -5.72 | |||
| 2025-12-27 | 76.58 | 0.38 | -7.22 | 66.36 | 5.46 | -3.74 | 47.27 | 3.17 | -4.33 | 33.70 | 1.70 | -5.80 |
| 2025-12-26 | 76.58 | 0.38 | -7.22 | 66.33 | 5.43 | -3.77 | 47.06 | 2.96 | -4.54 | 32.63 | 0.63 | -6.87 |
| 2025-12-25 | 65.10 | 4.20 | -5.00 | 46.72 | 2.62 | -4.88 | 30.29 | |||||
| 2025-12-24 | 64.97 | 4.07 | -5.13 | 46.70 | 2.60 | -4.90 | 28.36 | |||||
| 2025-12-23 | 64.92 | 4.02 | -5.18 | 46.43 | 2.33 | -5.17 | 27.36 | |||||
| 2025-12-22 | 60.41 | 44.81 | 0.71 | -6.79 | 22.58 | |||||||
| 2025-12-21 | 59.51 | 18.19 | ||||||||||
| 2025-12-20 | 59.51 | 16.64 | ||||||||||
| 2025-12-19 | 59.51 | 15.53 | ||||||||||
| 2025-12-18 | 59.50 | 43.80 | 14.39 | |||||||||
| 2025-12-17 | 59.50 | 14.05 | ||||||||||
| 2025-12-16 | 59.50 | 13.54 | ||||||||||
| 2025-12-15 | 59.50 | 13.32 | ||||||||||
| 2025-12-14 | 59.50 | 13.20 | ||||||||||
| 2025-12-13 | 59.50 | 13.08 | ||||||||||
| 2025-12-12 | 59.50 | 13.02 | ||||||||||
| 2025-12-11 | 59.50 | 13.06 | ||||||||||
| 2025-12-10 | 59.50 | 13.13 | ||||||||||
| 2025-12-09 | 59.50 | 13.19 | ||||||||||
| 2025-12-08 | 59.50 | 13.22 | ||||||||||
| 2025-12-07 | 59.50 | 13.26 | ||||||||||
| 2025-12-06 | 59.50 | 13.35 | ||||||||||
| 2025-12-05 | 59.50 | 13.40 | ||||||||||
| 2025-12-04 | 59.50 | 13.53 | ||||||||||
| 2025-12-03 | 59.50 | 13.61 | ||||||||||
| 2025-12-02 | 59.50 | 13.68 | ||||||||||
| 2025-12-01 | 59.50 | 13.81 | ||||||||||
| 2025-11-30 | 59.50 | 13.88 | ||||||||||
| 2025-11-29 | 59.50 | 13.97 | ||||||||||
| 2025-11-28 | 59.50 | 14.07 | ||||||||||
| 2025-11-27 | 59.50 | 14.17 | ||||||||||
| 2025-11-26 | 59.50 | 14.48 | ||||||||||
| 2025-11-25 | 59.50 | 14.90 | ||||||||||
| 2025-11-24 | 59.50 | 15.34 | ||||||||||
| 2025-11-23 | 59.50 | 15.91 | ||||||||||
| 2025-11-22 | 59.50 | 16.21 | ||||||||||
| 2025-11-21 | 59.50 | 17.03 | ||||||||||
| 2025-11-20 | 59.50 | 18.51 | ||||||||||
| 2025-11-19 | 59.50 | 18.52 | ||||||||||
| 2025-11-18 | 59.50 | 15.87 | ||||||||||
| 2025-11-17 | 59.50 | 15.22 | ||||||||||
| 2025-11-16 | 59.50 | 15.32 | ||||||||||
| 2025-11-15 | 59.50 | 14.48 | ||||||||||
| 2025-11-14 | 59.50 | 13.30 | ||||||||||
| 2025-11-13 | 59.50 | 12.63 | ||||||||||
| 2025-11-12 | 59.50 | 12.54 | ||||||||||
| 2025-11-11 | 59.50 | 12.74 | ||||||||||
| 2025-11-10 | 59.50 | 13.07 | ||||||||||
| 2025-11-09 | 59.50 | 13.56 | ||||||||||
| 2025-11-08 | 59.50 | 14.09 | ||||||||||
| 2025-11-07 | 59.50 | 14.22 | ||||||||||
| 2025-11-06 | 59.50 | 14.21 | ||||||||||
| 2025-11-05 | 59.50 | 13.98 | ||||||||||
| 2025-11-04 | 59.50 | 13.91 | ||||||||||
| 2025-11-03 | 59.50 | 13.89 | ||||||||||
| 2025-11-02 | 59.50 | 13.67 | ||||||||||
| 2025-11-01 | 59.50 | 13.37 | ||||||||||
| 2025-10-31 | 59.50 | 13.42 | ||||||||||
| 2025-10-30 | 59.50 | 13.80 | ||||||||||
| 2025-10-29 | 59.50 | 14.44 | ||||||||||
| 2025-10-28 | 59.50 | 14.42 | ||||||||||
| 2025-10-27 | 59.50 | 14.24 | ||||||||||
| 2025-10-26 | 59.50 | 14.09 | ||||||||||
| 2025-10-25 | 59.50 | 14.04 | ||||||||||
| 2025-10-24 | 59.50 | 14.06 | ||||||||||
| 2025-10-23 | 59.50 | 14.14 | ||||||||||
| 2025-10-22 | 59.50 | 14.19 | ||||||||||
| 2025-10-21 | 59.50 | 14.40 | ||||||||||
| 2025-10-20 | 59.50 | 14.47 | ||||||||||
| 2025-10-19 | 59.50 | 14.48 | ||||||||||
| 2025-10-18 | 59.50 | 14.49 | ||||||||||
| 2025-10-17 | 59.50 | 14.40 | ||||||||||
| 2025-10-16 | 59.50 | 14.45 | ||||||||||
| 2025-10-15 | 59.50 | 14.42 | ||||||||||
| 2025-10-14 | 59.50 | 14.59 | ||||||||||
| 2025-10-13 | 59.50 | 14.66 | ||||||||||
| 2025-10-12 | 59.50 | 15.13 | ||||||||||
| 2025-10-11 | 59.50 | 15.69 | ||||||||||
| 2025-10-10 | 59.50 | 16.18 | ||||||||||
| 2025-10-09 | 59.50 | 16.47 | ||||||||||
| 2025-10-08 | 59.50 | 16.51 | ||||||||||
| 2025-10-07 | 59.50 | 16.72 | ||||||||||
| 2025-10-06 | 59.50 | 16.95 | ||||||||||
| 2025-10-05 | 59.50 | 17.08 | ||||||||||
| 2025-10-04 | 59.50 | 16.95 | ||||||||||
| 2025-10-03 | 59.50 | 16.77 | ||||||||||
| 2025-10-02 | 59.50 | 16.70 | ||||||||||
| 2025-10-01 | 59.50 | 16.70 | ||||||||||
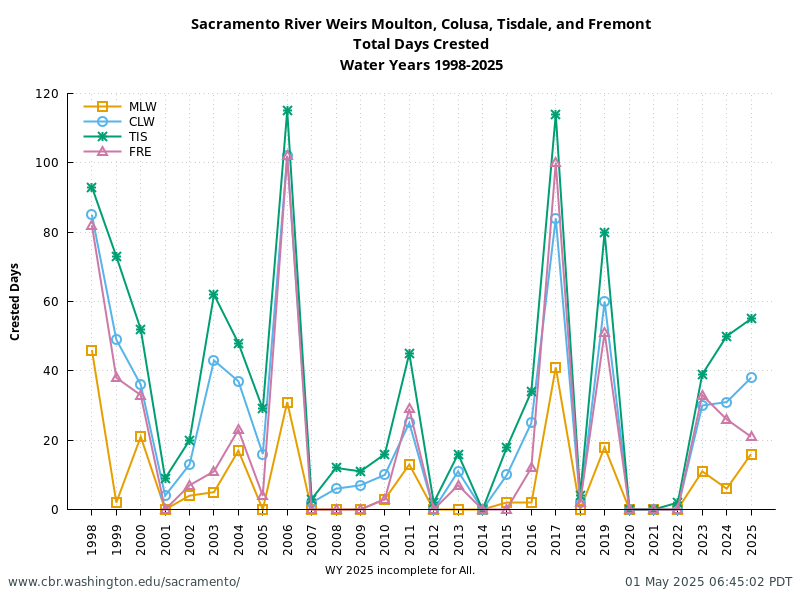
- WY 2026 Total Days: 270
- MLW Crest Days: 7 (2.59 %); Flood Days: 0; Danger Days: 0
- CLW Crest Days: 20 (7.41 %); Flood Days: 0; Danger Days: 0
- TIS Crest Days: 42 (15.56 %); Flood Days: 0; Danger Days: 0
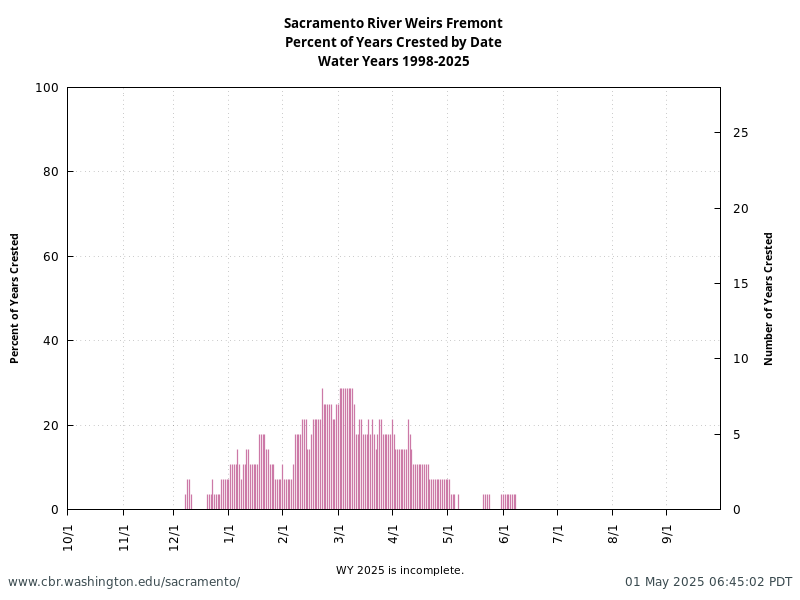
- FRE Crest Days: 19 (7.04 %); Flood Days: 0; Danger Days: 0
Overtopping History at Weirs
Data Notes
- At Tisdale, Moulton, and Colusa weirs, there is a minimum stage height to collect data. In the absence of data, the value is assumed below the stated minimum for the weir.
- Data is River Stage reported in Feet. Daily value is 24 hour average.
- Data Source: California Data Exchange Center
- Fremont Weir: On October 3, 2016, the California Department of Water Resources (DWR) changed the reporting of river stage data collected at 5 locations in the lower Sacramento River area from their previous datum, either National Geodetic Vertical Datum 1929 (NGVD29) or United Stated Engineering Datum (USED) to the North American Vertical Datum 1988 (NAVD88) standard.
- Moulton, Colusa, Tisdale weirs: On October 1, 2019, the California Department of Water Resources (DWR) changed the reporting of river stage data collected at 21 locations in the upper Sacramento River and Feather River area from their previous datum, either National Geodetic Vertical Datum 1929 (NGVD29), United States Engineering Datum (USED), or Local Datum to the North American Vertical Datum 1988 (NAVD88) standard.
Subscribe to Alerts
Please email web@cbr.washington.edu with the subject "SacPAS Weir Alert Subscription" to subscribe to the SacPAS Weir Alert email. At this time, subscribing and unsubscribing to the alert is a manual process.
Emails are generated once daily at 8:45 a.m. on days where the daily average river stage value for "yesterday" is greater than the crest level at least 1 of the 4 weirs being monitored or the NWPS Forecast is greater than the crest level.
Sample email content for 22 December 2021:
ALERT

NWS Forecast: Tisdale (TIS) on 12/25 to crest minimum 44.1: + 0.44 ft.

WY 2022 (82 Days) Summary
Moulton (MLW) Crest Days: 0 (0.00 %) Flood Days: 0 Danger Days: 0
Colusa (CLW) Crest Days: 0 (0.00 %) Flood Days: 0 Danger Days: 0
Tisdale (TIS) Crest Days: 3 (3.66 %) Flood Days: 0 Danger Days: 0
Fremont (FRE) Crest Days: 0 (0.00 %) Flood Days: 0 Danger Days: 0

To see full analysis, please refer to "Alert: Sacramento River Weirs Overtopping" on SacPAS website.
URL: www.cbr.washington.edu/sacramento//data/alert_weirs.html


Thank you,
SacPAS Web Team
===============
This is automatic email generated by analysis at 22 Dec 2021 09:15:02 PST
Replies to this email go unanswered.