SacPAS: Central Valley Prediction & Assessment of Salmon

UW Columbia Basin Research
Home Data Queries & Alerts Work Groups & Teams Fish Model Tools Contact
Alert: Weir Overtopping Temperature Thresholds Juvenile Monitoring & Sampling Juvenile Salvage & Loss Adult Escapement River Conditions Exposure Index Data Sites & Inventory

All Years River Graph Query

Data Courtesy of CDEC

Queries: River Graph&Text || River Graph&Text Map || Daily River Table || All Years River Graph || Basin Conditions

Limit Locations by Hydrologic Area

All Locations Sacramento River Basin San Joaquin River Basin Delta

Select Location, River Data

For special parameters, select Combined from All Locations list.
Please refer to the River Parameters inventory below to look up location-parameter availability.

Select Graph Format

Heatmap
Set Heatmap Scale
Autoscale (to data)
Range Min   < Max  (allowed: Min only, Max only, Min<Max)
Select Heatmap Color Palette
Default
Cold->Hotsample image (blue to red) Dry->Wetsample image (brown to blue)
Viridis Palette*sample image (purple to yellow) Plasma Palette*sample image (blue to yellow)
* best for color vision deficiency and B/W printing
Threshold Plot Value  (2 color plot)
Continuous Line Plot

Select Month Range

Start End

Month Range selection is restricted to month order within a water year (i.e., acceptable: November-April, not-acceptable: April-November). Month Range is inclusive. To view only one month, select same month from both menus.


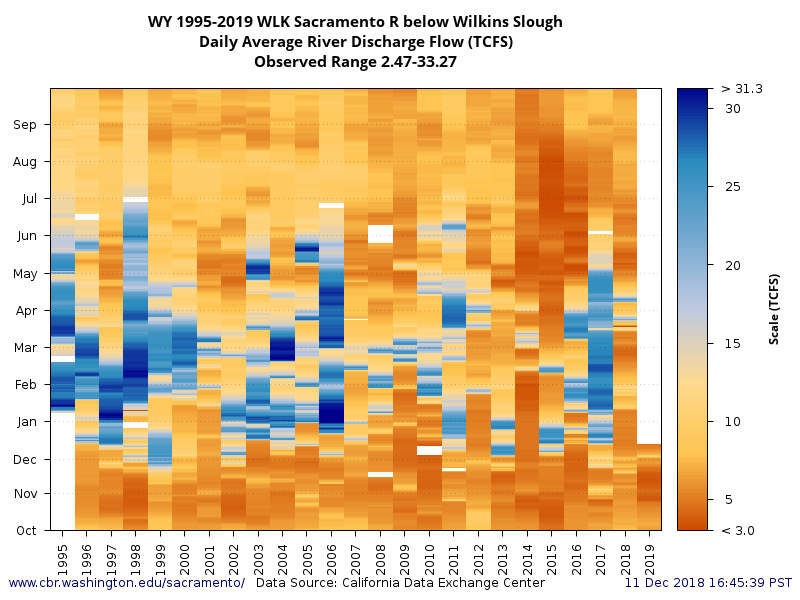
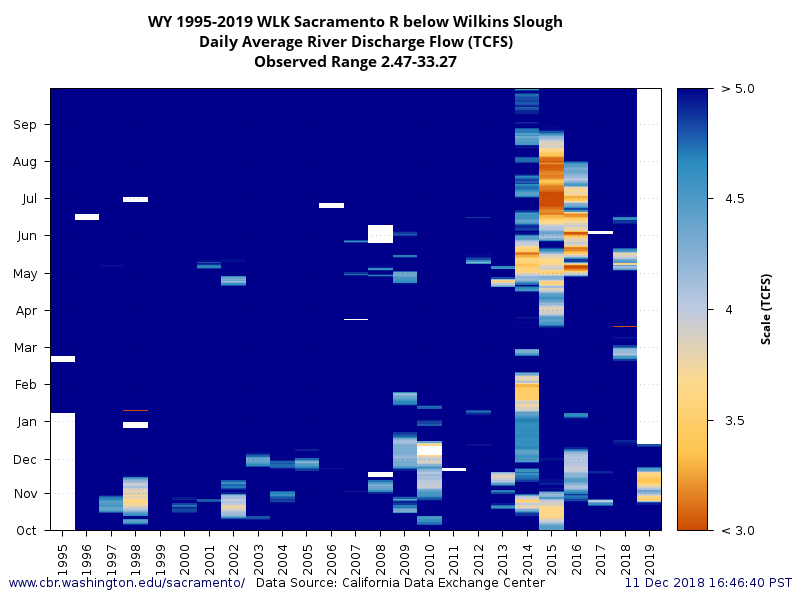
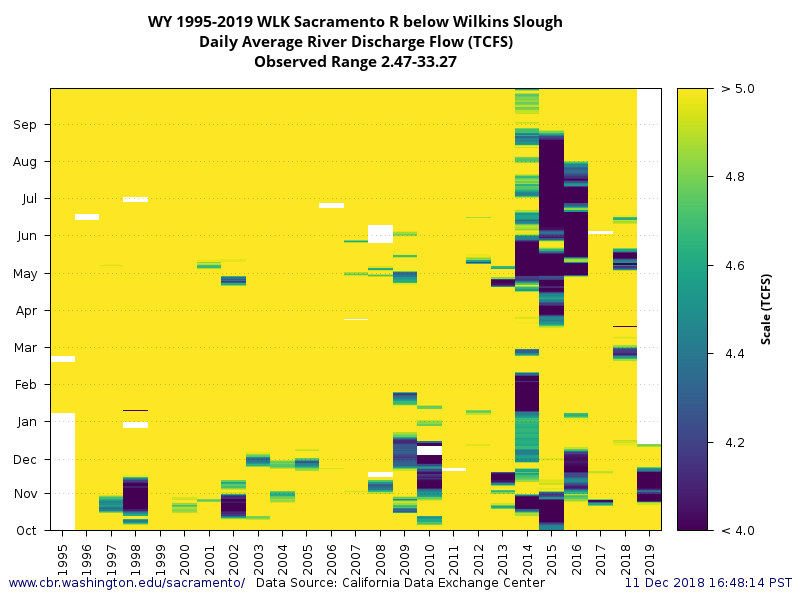
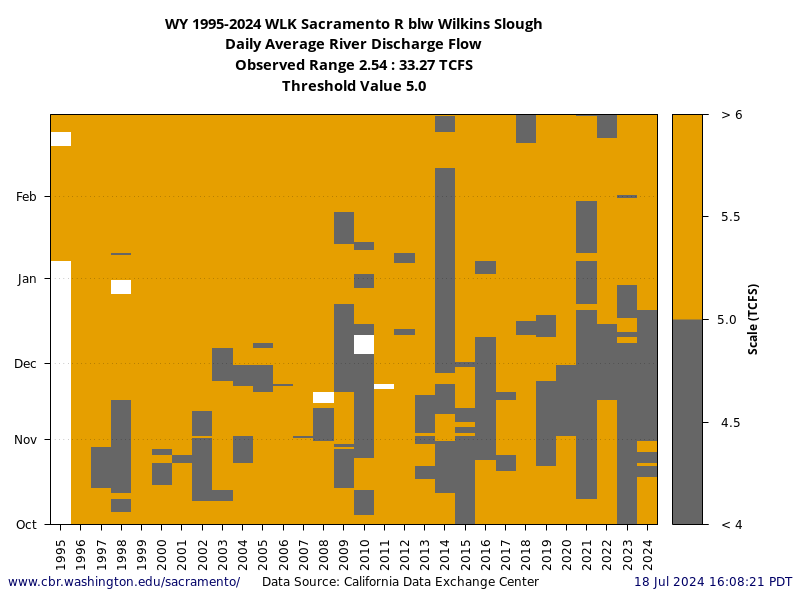
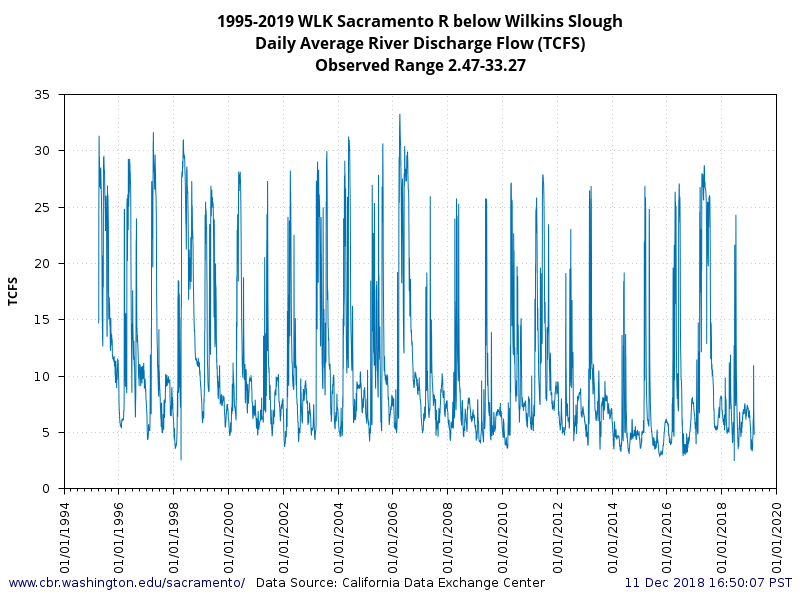
Examples: Wilkins Slough, Flow
Heatmap Autoscale, Default Palette Heatmap Range Max set, Default Palette Heatmap Range Min<Max set, Viridis Palette
Threshold Plot Line Plot  


Home | Data Queries & Alerts | Work Groups & Teams | Fish Model | Tools | Contact


POC: web@cbr.washington.edu

SacPAS: Central Valley Prediction & Assessment of Salmon, University of Washington, Columbia Basin Research, www.cbr.washington.edu/sacramento/

Wednesday, 19-Apr-2023 17:17:33 PDT