
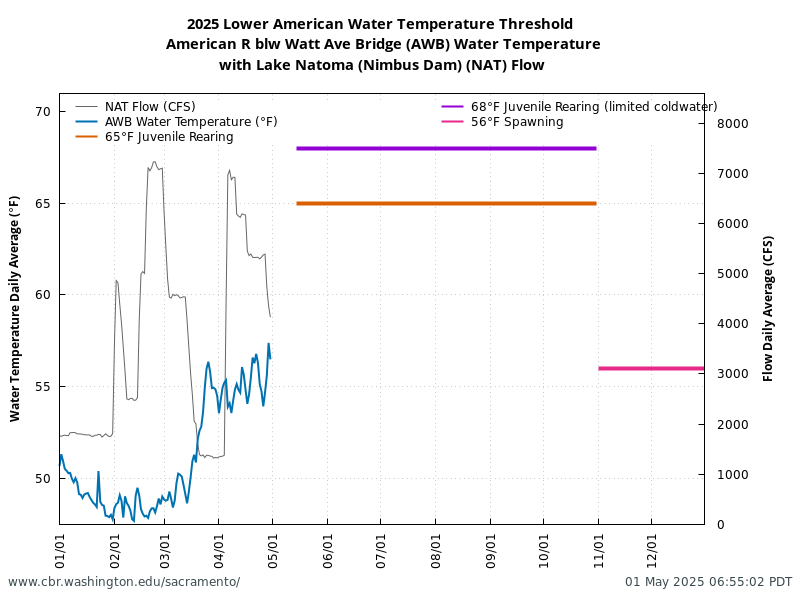
Lower American Water Temperature Threshold
This page provides analysis, based on Reclamation 2019 Proposed Action, of current and historical water temperature conditions for fish using only observed data. Actual pre-season and in-season management decision processes are complex employing multiple sources of observed data, models, and forecasts. For further information, see the Thresholds section.
| Steelhead Life Stage |
Life Stage Dates |
Criterion | Possible Days |
Data Days |
Missing Data Days |
Total Period Analyzed | Criteria Exceedance | |||
|---|---|---|---|---|---|---|---|---|---|---|
| Average Water Temperature |
Days in Threshold |
Days | First Day | Last Day | ||||||
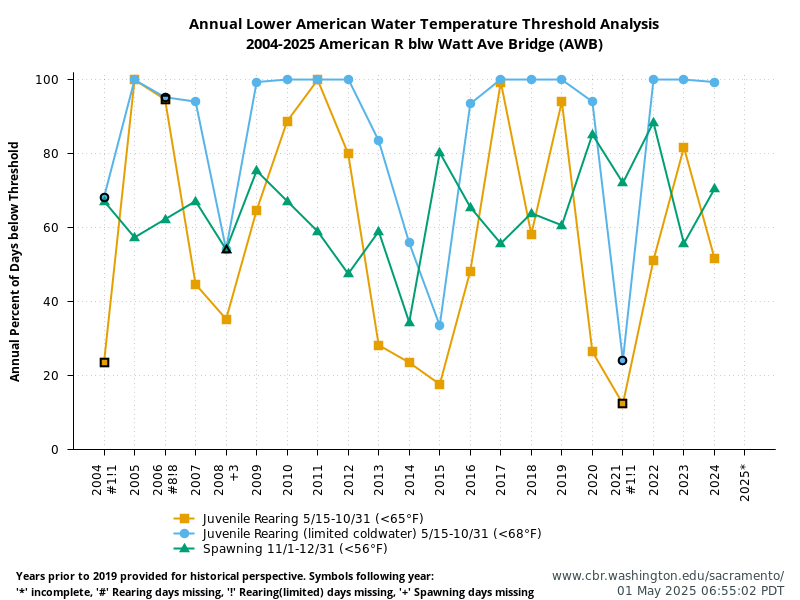
| Juvenile Rearing | 5/15-10/31 | Below/Equal 65°F | 170 | 44 | 0 | 62.4°F | 38 | 6 | 06/04 | 06/12 |
| Juvenile Rearing (limited coldwater) | 5/15-10/31 | Below/Equal 68°F | 170 | 44 | 0 | 62.4°F | 44 | 0 | ||
| Spawning | 11/1-12/31 | Below/Equal 56°F | 0 | 0 | 0 | |||||
| Date | Value | Rearing 65°F 5/15-10/31 |
Rearing (limited coldwater) 68°F 5/15-10/31 |
Spawning 56°F 11/1-12/31 |
|---|---|---|---|---|
| Date | Value | Rearing 65°F 5/15-10/31 |
Rearing (limited coldwater) 68°F 5/15-10/31 |
Spawning 56°F 11/1-12/31 |
| 2026-06-27 | 62.10 | Below | Below | |
| 2026-06-26 | 61.68 | Below | Below | |
| 2026-06-25 | 61.92 | Below | Below | |
| 2026-06-24 | 61.82 | Below | Below | |
| 2026-06-23 | 61.66 | Below | Below | |
| 2026-06-22 | 61.92 | Below | Below | |
| 2026-06-21 | 62.01 | Below | Below | |
| 2026-06-20 | 62.07 | Below | Below | |
| 2026-06-19 | 62.41 | Below | Below | |
| 2026-06-18 | 63.50 | Below | Below | |
| 2026-06-17 | 63.88 | Below | Below | |
| 2026-06-16 | 64.39 | Below | Below | |
| 2026-06-15 | 64.83 | Below | Below | |
| 2026-06-14 | 64.46 | Below | Below | |
| 2026-06-13 | 64.70 | Below | Below | |
| 2026-06-12 | 65.24 | Above | Below | |
| 2026-06-11 | 66.79 | Above | Below | |
| 2026-06-10 | 66.51 | Above | Below | |
| 2026-06-09 | 65.45 | Above | Below | |
| 2026-06-08 | 64.87 | Below | Below | |
| 2026-06-07 | 64.14 | Below | Below | |
| 2026-06-06 | 64.74 | Below | Below | |
| 2026-06-05 | 66.22 | Above | Below | |
| 2026-06-04 | 65.57 | Above | Below | |
| 2026-06-03 | 63.79 | Below | Below | |
| 2026-06-02 | 62.61 | Below | Below | |
| 2026-06-01 | 62.09 | Below | Below | |
| 2026-05-31 | 61.68 | Below | Below | |
| 2026-05-30 | 60.72 | Below | Below | |
| 2026-05-29 | 59.81 | Below | Below | |
| 2026-05-28 | 59.99 | Below | Below | |
| 2026-05-27 | 60.46 | Below | Below | |
| 2026-05-26 | 59.64 | Below | Below | |
| 2026-05-25 | 60.78 | Below | Below | |
| 2026-05-24 | 61.01 | Below | Below | |
| 2026-05-23 | 60.91 | Below | Below | |
| 2026-05-22 | 61.26 | Below | Below | |
| 2026-05-21 | 61.04 | Below | Below | |
| 2026-05-20 | 60.15 | Below | Below | |
| 2026-05-19 | 60.21 | Below | Below | |
| 2026-05-18 | 59.57 | Below | Below | |
| 2026-05-17 | 59.19 | Below | Below | |
| 2026-05-16 | 59.25 | Below | Below | |
| 2026-05-15 | 59.45 | Below | Below | |
| 2026-05-14 | 58.98 | |||
| 2026-05-13 | 58.33 | |||
| 2026-05-12 | 58.60 | |||
| 2026-05-11 | 58.65 | |||
| 2026-05-10 | 58.26 | |||
| 2026-05-09 | 58.57 | |||
| 2026-05-08 | 58.16 | |||
| 2026-05-07 | 58.42 | |||
| 2026-05-06 | 56.70 | |||
| 2026-05-05 | 55.73 | |||
| 2026-05-04 | 55.44 | |||
| 2026-05-03 | 56.44 | |||
| 2026-05-02 | 56.72 | |||
| 2026-05-01 | 57.45 | |||
| 2026-04-30 | 57.50 | |||
| 2026-04-29 | 57.18 | |||
| 2026-04-28 | 56.37 | |||
| 2026-04-27 | 54.99 | |||
| 2026-04-26 | 54.05 | |||
| 2026-04-25 | 54.90 | |||
| 2026-04-24 | 56.79 | |||
| 2026-04-23 | 55.98 | |||
| 2026-04-22 | 54.39 | |||
| 2026-04-21 | 54.21 | |||
| 2026-04-20 | 55.43 | |||
| 2026-04-19 | 56.37 | |||
| 2026-04-18 | 55.37 | |||
| 2026-04-17 | 55.54 | |||
| 2026-04-16 | 55.32 | |||
| 2026-04-15 | 55.28 | |||
| 2026-04-14 | 55.25 | |||
| 2026-04-13 | 53.69 | |||
| 2026-04-12 | 53.75 | |||
| 2026-04-11 | 56.06 | |||
| 2026-04-10 | 56.92 | |||
| 2026-04-09 | 59.04 | |||
| 2026-04-08 | 58.82 | |||
| 2026-04-07 | 58.12 | |||
| 2026-04-06 | 58.68 | |||
| 2026-04-05 | 58.29 | |||
| 2026-04-04 | 59.04 | |||
| 2026-04-03 | 57.74 | |||
| 2026-04-02 | 56.83 | |||
| 2026-04-01 | 56.06 | |||
| 2026-03-31 | 57.25 | |||
| 2026-03-30 | 58.33 | |||
| 2026-03-29 | 59.17 | |||
| 2026-03-28 | 58.75 | |||
| 2026-03-27 | 58.51 | |||
| 2026-03-26 | 57.97 | |||
| 2026-03-25 | 57.70 | |||
| 2026-03-24 | 56.97 | |||
| 2026-03-23 | 56.76 | |||
| 2026-03-22 | 56.61 | |||
| 2026-03-21 | 56.52 | |||
| 2026-03-20 | 56.37 | |||
| 2026-03-19 | 55.22 | |||
| 2026-03-18 | 54.41 | |||
| 2026-03-17 | 54.03 | |||
| 2026-03-16 | 53.89 | |||
| 2026-03-15 | 53.60 | |||
| 2026-03-14 | 53.29 | |||
| 2026-03-13 | 53.05 | |||
| 2026-03-12 | 53.04 | |||
| 2026-03-11 | 53.09 | |||
| 2026-03-10 | 53.66 | |||
| 2026-03-09 | 54.40 | |||
| 2026-03-08 | 54.24 | |||
| 2026-03-07 | 53.24 | |||
| 2026-03-06 | 52.70 | |||
| 2026-03-05 | 52.41 | |||
| 2026-03-04 | 52.12 | |||
| 2026-03-03 | 51.75 | |||
| 2026-03-02 | 51.33 | |||
| 2026-03-01 | 51.50 | |||
| 2026-02-28 | 52.00 | |||
| 2026-02-27 | 52.01 | |||
| 2026-02-26 | 51.30 | |||
| 2026-02-25 | 50.62 | |||
| 2026-02-24 | 50.74 | |||
| 2026-02-23 | 51.15 | |||
| 2026-02-22 | 51.04 | |||
| 2026-02-21 | 50.10 | |||
| 2026-02-20 | 49.30 | |||
| 2026-02-19 | 49.39 | |||
| 2026-02-18 | 49.35 | |||
| 2026-02-17 | 49.93 | |||
| 2026-02-16 | 51.50 | |||
| 2026-02-15 | 51.97 | |||
| 2026-02-14 | 51.52 | |||
| 2026-02-13 | 51.19 | |||
| 2026-02-12 | 51.27 | |||
| 2026-02-11 | 51.03 | |||
| 2026-02-10 | 50.33 | |||
| 2026-02-09 | 50.87 | |||
| 2026-02-08 | 50.67 | |||
| 2026-02-07 | 50.40 | |||
| 2026-02-06 | 50.50 | |||
| 2026-02-05 | 50.47 | |||
| 2026-02-04 | 50.38 | |||
| 2026-02-03 | 50.25 | |||
| 2026-02-02 | 50.17 | |||
| 2026-02-01 | 50.15 | |||
| 2026-01-31 | 50.35 | |||
| 2026-01-30 | 50.57 | |||
| 2026-01-29 | 50.62 | |||
| 2026-01-28 | 50.64 | |||
| 2026-01-27 | 49.76 | |||
| 2026-01-26 | 49.62 | |||
| 2026-01-25 | 49.41 | |||
| 2026-01-24 | 50.09 | |||
| 2026-01-23 | 49.33 | |||
| 2026-01-22 | 49.91 | |||
| 2026-01-21 | 50.18 | |||
| 2026-01-20 | 50.36 | |||
| 2026-01-19 | 50.22 | |||
| 2026-01-18 | 50.72 | |||
| 2026-01-17 | 50.93 | |||
| 2026-01-16 | 51.05 | |||
| 2026-01-15 | 51.05 | |||
| 2026-01-14 | 51.10 | |||
| 2026-01-13 | 51.68 | |||
| 2026-01-12 | 50.60 | |||
| 2026-01-11 | 51.16 | |||
| 2026-01-10 | 51.19 | |||
| 2026-01-09 | 51.12 | |||
| 2026-01-08 | 51.06 | |||
| 2026-01-07 | 51.68 | |||
| 2026-01-06 | 51.75 | |||
| 2026-01-05 | 51.41 | |||
| 2026-01-04 | 50.50 | |||
| 2026-01-03 | 51.21 | |||
| 2026-01-02 | 51.41 | |||
| 2026-01-01 | 51.14 |
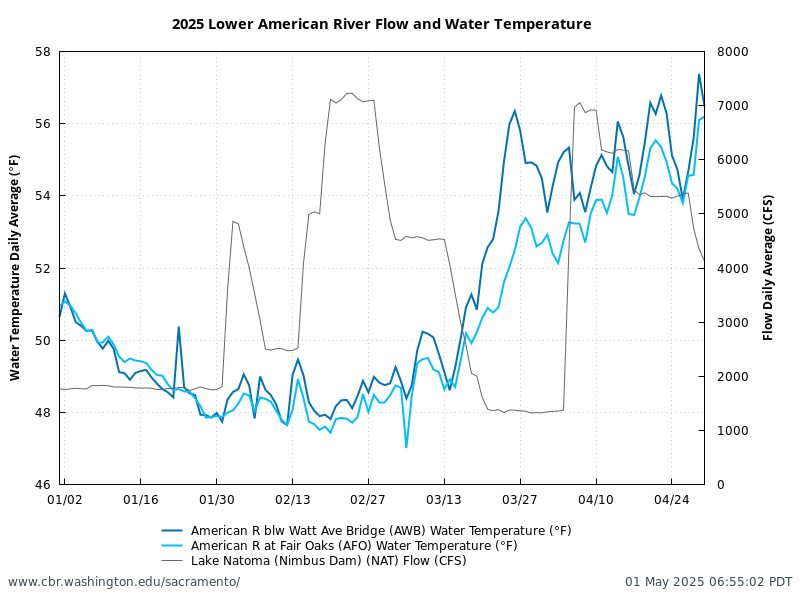
| Date | Lake Natoma (Nimbus Dam) (NAT) Reservoir Outflow (CFS) |
American R at Fair Oaks (AFO) Water Temperature (°F) |
American R blw Watt Ave Bridge (AWB) Water Temperature (°F) |
|---|---|---|---|
| 2026-01-01 | 4808.46 | 50.89 | 51.14 |
| 2026-01-02 | 4992.67 | 50.93 | 51.41 |
| 2026-01-03 | 6736.67 | 50.66 | 51.21 |
| 2026-01-04 | 9731.75 | 50.43 | 50.50 |
| 2026-01-05 | 10942.54 | 51.54 | 51.41 |
| 2026-01-06 | 10861.21 | 51.56 | 51.75 |
| 2026-01-07 | 10964.63 | 51.53 | 51.68 |
| 2026-01-08 | 11088.67 | 51.00 | 51.06 |
| 2026-01-09 | 10772.75 | 51.26 | 51.12 |
| 2026-01-10 | 9254.79 | 51.16 | 51.19 |
| 2026-01-11 | 8166.50 | 51.08 | 51.16 |
| 2026-01-12 | 7109.75 | 50.81 | 50.60 |
| 2026-01-13 | 6260.83 | 50.72 | 51.68 |
| 2026-01-14 | 5540.75 | 50.60 | 51.10 |
| 2026-01-15 | 4977.88 | 50.48 | 51.05 |
| 2026-01-16 | 4444.46 | 50.47 | 51.05 |
| 2026-01-17 | 3966.33 | 50.28 | 50.93 |
| 2026-01-18 | 3916.04 | 50.07 | 50.72 |
| 2026-01-19 | 3485.46 | 49.72 | 50.22 |
| 2026-01-20 | 3482.96 | 49.69 | 50.36 |
| 2026-01-21 | 3489.71 | 49.55 | 50.18 |
| 2026-01-22 | 3495.46 | 49.33 | 49.91 |
| 2026-01-23 | 3511.83 | 49.05 | 49.33 |
| 2026-01-24 | 3518.92 | 49.33 | 50.09 |
| 2026-01-25 | 3521.79 | 49.20 | 49.41 |
| 2026-01-26 | 3518.75 | 49.05 | 49.62 |
| 2026-01-27 | 3529.50 | 49.21 | 49.76 |
| 2026-01-28 | 3100.96 | 49.56 | 50.64 |
| 2026-01-29 | 2569.29 | 49.57 | 50.62 |
| 2026-01-30 | 2511.13 | 49.62 | 50.57 |
| 2026-01-31 | 3926.67 | 49.45 | 50.35 |
| 2026-02-01 | 4922.58 | 49.20 | 50.15 |
| 2026-02-02 | 4859.88 | 49.39 | 50.17 |
| 2026-02-03 | 4877.29 | 49.37 | 50.25 |
| 2026-02-04 | 4881.83 | 49.51 | 50.38 |
| 2026-02-05 | 4889.96 | 49.50 | 50.47 |
| 2026-02-06 | 4898.74 | 49.54 | 50.50 |
| 2026-02-07 | 4874.17 | 49.48 | 50.40 |
| 2026-02-08 | 4560.75 | 49.57 | 50.67 |
| 2026-02-09 | 4513.04 | 50.00 | 50.87 |
| 2026-02-10 | 4073.96 | 49.59 | 50.33 |
| 2026-02-11 | 3578.00 | 49.73 | 51.03 |
| 2026-02-12 | 3472.46 | 50.05 | 51.27 |
| 2026-02-13 | 3068.29 | 50.15 | 51.19 |
| 2026-02-14 | 2568.08 | 50.53 | 51.52 |
| 2026-02-15 | 2512.79 | 50.43 | 51.97 |
| 2026-02-16 | 2525.92 | 50.34 | 51.50 |
| 2026-02-17 | 2514.75 | 50.01 | 49.93 |
| 2026-02-18 | 2504.96 | 49.32 | 49.35 |
| 2026-02-19 | 2513.92 | 48.66 | 49.39 |
| 2026-02-20 | 2537.71 | 48.92 | 49.30 |
| 2026-02-21 | 2529.17 | 49.38 | 50.10 |
| 2026-02-22 | 2536.50 | 49.73 | 51.04 |
| 2026-02-23 | 4076.33 | 49.98 | 51.15 |
| 2026-02-24 | 5028.75 | 49.58 | 50.74 |
| 2026-02-25 | 5040.71 | 49.29 | 50.62 |
| 2026-02-26 | 4921.50 | 49.62 | 51.30 |
| 2026-02-27 | 4467.63 | 50.35 | 52.01 |
| 2026-02-28 | 3956.88 | 50.03 | 52.00 |
| 2026-03-01 | 3429.29 | 49.48 | 51.50 |
| 2026-03-02 | 2889.75 | 49.48 | 51.33 |
| 2026-03-03 | 2384.92 | 49.67 | 51.75 |
| 2026-03-04 | 1932.25 | 50.09 | 52.12 |
| 2026-03-05 | 1530.63 | 50.37 | 52.41 |
| 2026-03-06 | 1512.46 | 50.39 | 52.70 |
| 2026-03-07 | 1533.42 | 51.01 | 53.24 |
| 2026-03-08 | 1473.74 | 51.16 | 54.24 |
| 2026-03-09 | 2064.33 | 51.00 | 54.40 |
| 2026-03-10 | 2494.88 | 51.12 | 53.66 |
| 2026-03-11 | 2493.67 | 50.63 | 53.09 |
| 2026-03-12 | 2494.33 | 50.55 | 53.04 |
| 2026-03-13 | 2487.63 | 50.48 | 53.05 |
| 2026-03-14 | 2446.96 | 50.67 | 53.29 |
| 2026-03-15 | 2496.46 | 50.88 | 53.60 |
| 2026-03-16 | 2466.67 | 50.77 | 53.89 |
| 2026-03-17 | 2491.54 | 50.74 | 54.03 |
| 2026-03-18 | 2495.33 | 51.10 | 54.41 |
| 2026-03-19 | 2277.67 | 52.48 | 55.22 |
| 2026-03-20 | 2226.54 | 53.03 | 56.37 |
| 2026-03-21 | 2204.88 | 53.13 | 56.52 |
| 2026-03-22 | 1882.04 | 53.20 | 56.61 |
| 2026-03-23 | 1810.17 | 53.08 | 56.76 |
| 2026-03-24 | 1537.46 | 53.72 | 56.97 |
| 2026-03-25 | 1519.88 | 53.74 | 57.70 |
| 2026-03-26 | 1207.79 | 54.47 | 57.97 |
| 2026-03-27 | 1182.75 | 54.63 | 58.51 |
| 2026-03-28 | 1183.29 | 54.18 | 58.75 |
| 2026-03-29 | 1184.33 | 54.24 | 59.17 |
| 2026-03-30 | 1161.33 | 54.22 | 58.33 |
| 2026-03-31 | 1139.63 | 53.75 | 57.25 |
| 2026-04-01 | 1161.42 | 54.05 | 56.06 |
| 2026-04-02 | 1162.00 | 54.27 | 56.83 |
| 2026-04-03 | 1160.04 | 55.01 | 57.74 |
| 2026-04-04 | 1390.25 | 54.56 | 59.04 |
| 2026-04-05 | 1505.13 | 54.60 | 58.29 |
| 2026-04-06 | 1513.96 | 54.43 | 58.68 |
| 2026-04-07 | 1508.63 | 54.22 | 58.12 |
| 2026-04-08 | 1511.71 | 54.88 | 58.82 |
| 2026-04-09 | 1819.79 | 54.30 | 59.04 |
| 2026-04-10 | 1999.54 | 54.53 | 56.92 |
| 2026-04-11 | 4665.04 | 53.97 | 56.06 |
| 2026-04-12 | 7275.63 | 52.66 | 53.75 |
| 2026-04-13 | 7248.63 | 52.52 | 53.69 |
| 2026-04-14 | 7238.63 | 54.05 | 55.25 |
| 2026-04-15 | 6567.29 | 53.80 | 55.28 |
| 2026-04-16 | 6449.79 | 53.92 | 55.32 |
| 2026-04-17 | 6493.08 | 54.69 | 55.54 |
| 2026-04-18 | 6461.46 | 53.69 | 55.37 |
| 2026-04-19 | 6497.75 | 54.78 | 56.37 |
| 2026-04-20 | 6567.38 | 54.30 | 55.43 |
| 2026-04-21 | 7140.71 | 53.17 | 54.21 |
| 2026-04-22 | 7497.83 | 53.40 | 54.39 |
| 2026-04-23 | 7439.96 | 54.97 | 55.98 |
| 2026-04-24 | 6991.13 | 55.23 | 56.79 |
| 2026-04-25 | 6591.29 | 53.70 | 54.90 |
| 2026-04-26 | 6126.08 | 52.81 | 54.05 |
| 2026-04-27 | 5528.67 | 53.66 | 54.99 |
| 2026-04-28 | 5063.17 | 54.81 | 56.37 |
| 2026-04-29 | 4564.17 | 55.09 | 57.18 |
| 2026-04-30 | 4063.92 | 54.73 | 57.50 |
| 2026-05-01 | 3611.71 | 54.61 | 57.45 |
| 2026-05-02 | 3167.58 | 54.27 | 56.72 |
| 2026-05-03 | 3071.58 | 54.45 | 56.44 |
| 2026-05-04 | 3088.79 | 54.36 | 55.44 |
| 2026-05-05 | 3075.04 | 53.45 | 55.73 |
| 2026-05-06 | 3073.50 | 54.49 | 56.70 |
| 2026-05-07 | 3051.58 | 55.03 | 58.42 |
| 2026-05-08 | 3763.88 | 55.05 | 58.16 |
| 2026-05-09 | 4017.21 | 55.68 | 58.57 |
| 2026-05-10 | 4004.25 | 55.22 | 58.26 |
| 2026-05-11 | 3958.71 | 55.85 | 58.65 |
| 2026-05-12 | 3562.50 | 55.12 | 58.60 |
| 2026-05-13 | 3519.79 | 55.50 | 58.33 |
| 2026-05-14 | 3504.25 | 56.43 | 58.98 |
| 2026-05-15 | 3491.58 | 56.51 | 59.45 |
| 2026-05-16 | 3472.21 | 56.70 | 59.25 |
| 2026-05-17 | 3033.29 | 57.46 | 59.19 |
| 2026-05-18 | 2976.54 | 56.74 | 59.57 |
| 2026-05-19 | 2613.63 | 56.60 | 60.21 |
| 2026-05-20 | 2095.75 | 56.00 | 60.15 |
| 2026-05-21 | 2036.13 | 56.75 | 61.04 |
| 2026-05-22 | 2019.95 | 56.45 | 61.26 |
| 2026-05-23 | 2008.33 | 56.47 | 60.91 |
| 2026-05-24 | 1985.38 | 56.93 | 61.01 |
| 2026-05-25 | 2007.38 | 56.81 | 60.78 |
| 2026-05-26 | 2008.17 | 57.56 | 59.64 |
| 2026-05-27 | 2021.75 | 57.13 | 60.46 |
| 2026-05-28 | 2029.13 | 56.91 | 59.99 |
| 2026-05-29 | 2028.58 | 56.64 | 59.81 |
| 2026-05-30 | 2026.00 | 56.73 | 60.72 |
| 2026-05-31 | 1947.04 | 57.15 | 61.68 |
| 2026-06-01 | 2006.08 | 57.55 | 62.09 |
| 2026-06-02 | 1566.92 | 57.60 | 62.61 |
| 2026-06-03 | 1180.38 | 57.88 | 63.79 |
| 2026-06-04 | 1149.29 | 58.68 | 65.57 |
| 2026-06-05 | 1155.63 | 58.60 | 66.22 |
| 2026-06-06 | 1149.29 | 58.38 | 64.74 |
| 2026-06-07 | 1150.75 | 59.41 | 64.14 |
| 2026-06-08 | 1146.08 | 58.68 | 64.87 |
| 2026-06-09 | 1043.63 | 59.10 | 65.45 |
| 2026-06-10 | 1137.88 | 59.66 | 66.51 |
| 2026-06-11 | 1426.96 | 59.12 | 66.79 |
| 2026-06-12 | 1876.83 | 58.65 | 65.24 |
| 2026-06-13 | 2035.54 | 59.49 | 64.70 |
| 2026-06-14 | 2032.25 | 59.41 | 64.46 |
| 2026-06-15 | 2030.08 | 59.75 | 64.83 |
| 2026-06-16 | 2314.29 | 59.46 | 64.39 |
| 2026-06-17 | 2448.13 | 59.69 | 63.88 |
| 2026-06-18 | 2797.17 | 59.43 | 63.50 |
| 2026-06-19 | 3617.58 | 59.62 | 62.41 |
| 2026-06-20 | 3918.54 | 58.89 | 62.07 |
| 2026-06-21 | 3967.42 | 59.58 | 62.01 |
| 2026-06-22 | 3955.42 | 58.86 | 61.92 |
| 2026-06-23 | 3973.46 | 59.01 | 61.66 |
| 2026-06-24 | 3991.33 | 59.21 | 61.82 |
| 2026-06-25 | 4000.71 | 59.47 | 61.92 |
| 2026-06-26 | 4030.50 | 59.63 | 61.68 |
| 2026-06-27 | 3938.50 | 59.77 | 62.10 |
Query Notes
Data Methods
- Data Courtesy of CDEC
- Hourly data for American R blw Watt Ave Bridge (AWB) is retrieved from CDEC on a daily basis.
- Columbia Basin Research (CBR) QA/QC process on AWB hourly data for outliers, false data (e.g., 32°F measured by satellite), and data outside expected range of observation (e.g., 90°F). Data loaded into CBR database.
- CBR calculates Daily Average values based on CBR cleaned hourly values.
- Query for daily average water temperature for selected year.
- Examine daily average data record for 65°F exceedance.
- Examine daily average data record for 68°F exceedance.
Threshold Analysis Criteria
Please refer to the American River Group (ARG) Annual Report of Activities for details on within water year activities.
Target analysis and exceedance found on this page is based on criteria as described in Reclamation 2019, p4-2.
Reclamation 2019. Reinitiation of Consultation on the Coordinated Long-Term Operation of the Central Valley Project and State Water Project Central Valley Project, California Mid-Pacific Region, Final Biological Assessment, Chapter 4: Proposed Action. October 21. Available online: https://www.usbr.gov/mp/bdo/lto/biop.html