
DCC Operations
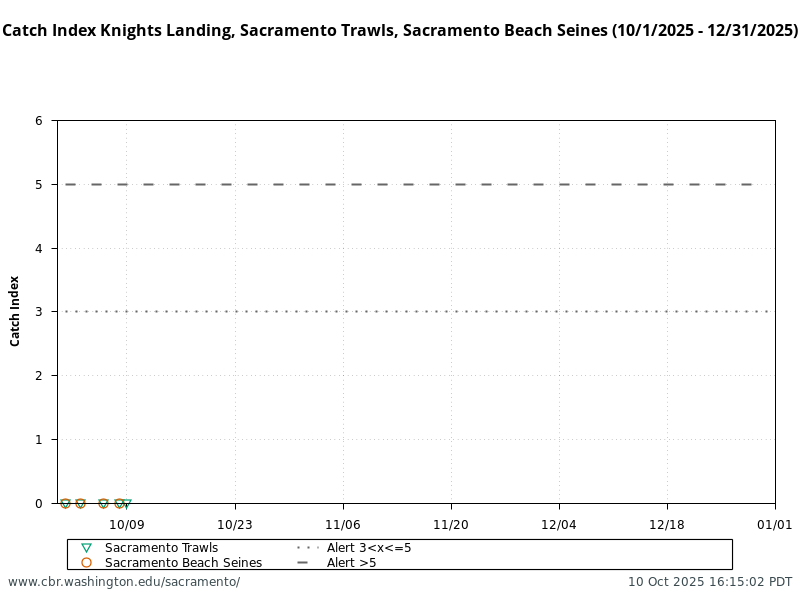
| Date | Knights Landing RST: Winter Chinook: Catch Index | Knights Landing RST: Older Chinook: Catch Index | Sacramento Trawls: Older Chinook: Catch Index | Sacramento Beach Seines: Older Chinook: Catch Index | Alert: Catch Index > 5 | Alert: Catch Index 3 < X ≤ 5 |
|---|---|---|---|---|---|---|
| 2025-12-30 | 4.0 | SacTrawl 4.0 | ||||
| 2025-12-29 | 1.6 | 24.0 | SacBeach 24.0 | |||
| 2025-12-28 | ||||||
| 2025-12-27 | ||||||
| 2025-12-26 | ||||||
| 2025-12-25 | ||||||
| 2025-12-24 | ||||||
| 2025-12-23 | 22.4 | 300.0 | SacTrawl 22.4 SacBeach 300.0 |
|||
| 2025-12-22 | 7.2 | 124.8 | SacTrawl 7.2 SacBeach 124.8 |
|||
| 2025-12-21 | ||||||
| 2025-12-20 | 1.7 | 1.7 | ||||
| 2025-12-19 | 0 | 0 | 0 | 96.0 | SacBeach 96.0 | |
| 2025-12-18 | 0 | 0 | ||||
| 2025-12-17 | 0 | 0 | 0 | 16.0 | SacBeach 16.0 | |
| 2025-12-16 | 0 | 0 | ||||
| 2025-12-15 | 0 | 0 | 0 | 41.1 | SacBeach 41.1 | |
| 2025-12-14 | 0 | 0 | ||||
| 2025-12-13 | 0.5 | 0.5 | ||||
| 2025-12-12 | 0.5 | 0.5 | 0.8 | 24.0 | SacBeach 24.0 | |
| 2025-12-11 | 1.8 | 1.8 | ||||
| 2025-12-10 | 1.8 | 1.8 | 1.6 | 30.0 | SacBeach 30.0 | |
| 2025-12-09 | 0.9 | 0.9 | ||||
| 2025-12-08 | 0.5 | 0.5 | 0 | 0 | ||
| 2025-12-07 | 0 | 0 | ||||
| 2025-12-06 | 0.5 | 0.5 | ||||
| 2025-12-05 | 0.9 | 0.9 | ||||
| 2025-12-04 | 1.0 | 1.0 | 0 | 48.0 | SacBeach 48.0 | |
| 2025-12-03 | 0 | 0 | 0 | 96.0 | SacBeach 96.0 | |
| 2025-12-02 | 1.6 | 1.6 | ||||
| 2025-12-01 | 0 | 0 | 0.8 | 0 | ||
| 2025-11-30 | 0 | 0 | ||||
| 2025-11-29 | ||||||
| 2025-11-28 | 24.0 | SacBeach 24.0 | ||||
| 2025-11-27 | ||||||
| 2025-11-26 | 3.6 | 3.6 | 0.8 | 40.0 | SacBeach 40.0 | KNLOlder 3.6 KNLWinter 3.6 |
| 2025-11-25 | 4.2 | 4.2 | 1.6 | KNLOlder 4.2 KNLWinter 4.2 |
||
| 2025-11-24 | 4.8 | 102.9 | SacBeach 102.9 | SacTrawl 4.8 | ||
| 2025-11-23 | ||||||
| 2025-11-22 | ||||||
| 2025-11-21 | 111.1 | 111.1 | 24.0 | 102.9 | KNLOlder 111.1 KNLWinter 111.1 SacTrawl 24.0 SacBeach 102.9 |
|
| 2025-11-20 | ||||||
| 2025-11-19 | 16.8 | 72.0 | SacTrawl 16.8 SacBeach 72.0 |
|||
| 2025-11-18 | 97.7 | 97.7 | KNLOlder 97.7 KNLWinter 97.7 |
|||
| 2025-11-17 | 5.6 | 64.0 | SacTrawl 5.6 SacBeach 64.0 |
|||
| 2025-11-16 | ||||||
| 2025-11-15 | ||||||
| 2025-11-14 | 3.4 | 3.4 | 8.8 | 12.0 | SacTrawl 8.8 SacBeach 12.0 |
KNLOlder 3.4 KNLWinter 3.4 |
| 2025-11-13 | 3.1 | 3.1 | KNLOlder 3.1 KNLWinter 3.1 |
|||
| 2025-11-12 | 4.4 | 4.4 | 0.8 | 41.1 | SacBeach 41.1 | KNLOlder 4.4 KNLWinter 4.4 |
| 2025-11-11 | 15.9 | 15.9 | KNLOlder 15.9 KNLWinter 15.9 |
|||
| 2025-11-10 | 21.0 | 21.0 | 0 | 6.0 | KNLOlder 21.0 KNLWinter 21.0 SacBeach 6.0 |
|
| 2025-11-09 | 0 | 0 | ||||
| 2025-11-08 | 2.5 | 2.5 | ||||
| 2025-11-07 | 1.4 | 1.4 | 24.0 | SacBeach 24.0 | ||
| 2025-11-06 | 1.6 | 1.6 | 0 | |||
| 2025-11-05 | 3.5 | 3.5 | 0 | 30.0 | SacBeach 30.0 | KNLOlder 3.5 KNLWinter 3.5 |
| 2025-11-04 | 8.6 | 8.6 | KNLOlder 8.6 KNLWinter 8.6 |
|||
| 2025-11-03 | 21.2 | 21.2 | 0 | 34.3 | KNLOlder 21.2 KNLWinter 21.2 SacBeach 34.3 |
|
| 2025-11-02 | 14.1 | 14.1 | KNLOlder 14.1 KNLWinter 14.1 |
|||
| 2025-11-01 | 19.2 | 19.2 | KNLOlder 19.2 KNLWinter 19.2 |
|||
| 2025-10-31 | 5.7 | 5.7 | 0 | 48.0 | KNLOlder 5.7 KNLWinter 5.7 SacBeach 48.0 |
|
| 2025-10-30 | 5.6 | 5.6 | KNLOlder 5.6 KNLWinter 5.6 |
|||
| 2025-10-29 | 2.4 | 2.4 | 0 | 0 | ||
| 2025-10-28 | 4.0 | 4.0 | 0 | KNLOlder 4.0 KNLWinter 4.0 |
||
| 2025-10-27 | 5.2 | 5.2 | 16.0 | KNLOlder 5.2 KNLWinter 5.2 SacBeach 16.0 |
||
| 2025-10-26 | 0.6 | 0.6 | ||||
| 2025-10-25 | 1.5 | 1.5 | ||||
| 2025-10-24 | 9.4 | 9.4 | 0 | 13.7 | KNLOlder 9.4 KNLWinter 9.4 SacBeach 13.7 |
|
| 2025-10-23 | 10.0 | 10.0 | KNLOlder 10.0 KNLWinter 10.0 |
|||
| 2025-10-22 | 3.5 | 3.5 | 0 | 13.7 | SacBeach 13.7 | KNLOlder 3.5 KNLWinter 3.5 |
| 2025-10-21 | 1.6 | 1.6 | ||||
| 2025-10-20 | 4.0 | 4.0 | 0 | 0 | KNLOlder 4.0 KNLWinter 4.0 |
|
| 2025-10-19 | 2.0 | 2.0 | ||||
| 2025-10-18 | 0.5 | 0.5 | ||||
| 2025-10-17 | 0.5 | 0.5 | 0 | 0 | ||
| 2025-10-16 | 0.6 | 0.6 | 0 | |||
| 2025-10-15 | 0 | 0 | 0 | |||
| 2025-10-14 | 0 | 0 | 0 | 0 | ||
| 2025-10-13 | 0 | 0 | ||||
| 2025-10-12 | ||||||
| 2025-10-11 | ||||||
| 2025-10-10 | 0 | |||||
| 2025-10-09 | 0 | 0 | 0 | |||
| 2025-10-08 | 0 | 0 | 0 | 0 | ||
| 2025-10-07 | 1.1 | 1.1 | ||||
| 2025-10-06 | 0 | 0 | 0 | 0 | ||
| 2025-10-05 | 0 | 0 | ||||
| 2025-10-04 | 0.5 | 0.5 | ||||
| 2025-10-03 | 0 | 0 | 0 | 0 | ||
| 2025-10-02 | 0 | 0 | ||||
| 2025-10-01 | 0.5 | 0.5 | 0 | 0 |
Part 1: DCC operations by Knights Landing or Sacramento Catch Indices (PA 4-56)
Monitoring period: 1 October-30 November
Water quality criteria per D-1641 are met and either the Knights Landing Catch Index or Sacramento Catch Index is greater than 5.0 fish per day (close until both < 3/day)
Water quality criteria per D-1641 are met, either Knights Landing Catch Index or the Sacramento Catch Index are greater than 3.0 fish per day but less than or equal to five fish per day. (closed for 3 days)
Alerts: Deer Creek, Mill Creek, Wilkins Slough, Knights Landing
| Date | Mill Creek (MLM): mean daily flow (cfs) | Mill Creek (MLM): flow percent change | Mill Creek (MLM): Alert | Deer Creek (DCV): mean daily flow (cfs) | Deer Creek (DCV): flow percent change | Deer Creek (DCV): Alert | Wilkins Slough (WLK): mean daily flow (cfs) | Knights Landing RST: water temperature (f) | WLK-KNL: Alert |
|---|---|---|---|---|---|---|---|---|---|
| 7/22/2026 | 133.1 | -2.2% | Flow>95cfs | 96.8 | -1.6% | Flow>95cfs | 7428.6 | ||
| 7/21/2026 | 136.1 | 0.9% | Flow>95cfs | 98.3 | 0.6% | Flow>95cfs | 7494.0 | ||
| 7/20/2026 | 134.9 | 0.0% | Flow>95cfs | 97.8 | 0.4% | Flow>95cfs | 7381.2 | ||
| 7/19/2026 | 134.9 | -0.1% | Flow>95cfs | 97.3 | 0.2% | Flow>95cfs | 7442.7 | ||
| 7/18/2026 | 135.1 | -0.7% | Flow>95cfs | 97.2 | -1.6% | Flow>95cfs | 7290.5 | ||
| 7/17/2026 | 136.0 | -3.5% | Flow>95cfs | 98.8 | -14.6% | Flow>95cfs | 7194.2 | ||
| 7/16/2026 | 141.0 | -4.7% | Flow>95cfs | 115.6 | -18.5% | Flow>95cfs | 7095.9 |
Monitor Deer Creek and Mill Creek for average daily flow >95 cfs or >50% change from prior day
Monitor for both conditions: Wilkins Slough average daily flow >7500 cfs and Knights Landing temperature <56.3F
Juvenile Sampling
Summary Last Two Weeks
| Date Range | Data Item | Butte Creek Diversion and RST | Tisdale Weir RST | Knights Landing RST | Lower Feather River RST | Lower Sacramento River RST | Sacramento Trawls (@ Sherwood Harbor) | Sacramento Beach Seines | Chipps Island Trawls | Mossdale Trawls |
|---|---|---|---|---|---|---|---|---|---|---|
| Date Range | Data Item | Butte Creek Diversion and RST | Tisdale Weir RST | Knights Landing RST | Lower Feather River RST | Lower Sacramento River RST | Sacramento Trawls (@ Sherwood Harbor) | Sacramento Beach Seines | Chipps Island Trawls | Mossdale Trawls |
| 07/16/2026-07/22/2026 | Min Sample Date | 2026-07-17 | 2026-07-17 | 2026-07-22 | 2026-07-17 | |||||
| 07/16/2026-07/22/2026 | Max Sample Date | 2026-07-22 | 2026-07-21 | 2026-07-22 | 2026-07-22 | |||||
| 07/16/2026-07/22/2026 | Days with Sampling | 0 | 3 | 0 | 0 | |||||
| 07/16/2026-07/22/2026 | Fall Chinook | 0 | 0 | 0 | 0 | |||||
| 07/16/2026-07/22/2026 | Spring Chinook | 0 | 0 | 0 | 0 | |||||
| 07/16/2026-07/22/2026 | Winter Chinook | 0 | 0 | 0 | 0 | |||||
| 07/16/2026-07/22/2026 | LateFall Chinook | 0 | 0 | 0 | 0 | |||||
| 07/16/2026-07/22/2026 | Chinook (ad-clip) | 0 | 0 | 0 | 0 | |||||
| 07/16/2026-07/22/2026 | Steelhead (natural) | 0 | 0 | 0 | 0 | |||||
| 07/16/2026-07/22/2026 | Steelhead (ad-clip) | 0 | 0 | 0 | 0 | |||||
| 07/16/2026-07/22/2026 | Avg Flow (cfs) | 171.2 | 8705.9 | 7332.4 | 8739.7 | 19977.1 | 19977.1 | 8405.0 | 555.1 | |
| 07/16/2026-07/22/2026 | Avg Water Temp (F) | 71.1 | 71.1 | 70.9 | 79.6 | |||||
| 07/16/2026-07/22/2026 | Avg Turbidity (NTU) | |||||||||
| 07/09/2026-07/15/2026 | Min Sample Date | 2026-07-09 | 2026-07-09 | 2026-07-09 | ||||||
| 07/09/2026-07/15/2026 | Max Sample Date | 2026-07-15 | 2026-07-13 | 2026-07-15 | ||||||
| 07/09/2026-07/15/2026 | Days with Sampling | 0 | 0 | 0 | ||||||
| 07/09/2026-07/15/2026 | Fall Chinook | 0 | 0 | 0 | ||||||
| 07/09/2026-07/15/2026 | Spring Chinook | 0 | 0 | 0 | ||||||
| 07/09/2026-07/15/2026 | Winter Chinook | 0 | 0 | 0 | ||||||
| 07/09/2026-07/15/2026 | LateFall Chinook | 0 | 0 | 0 | ||||||
| 07/09/2026-07/15/2026 | Chinook (ad-clip) | 0 | 0 | 0 | ||||||
| 07/09/2026-07/15/2026 | Steelhead (natural) | 0 | 0 | 0 | ||||||
| 07/09/2026-07/15/2026 | Steelhead (ad-clip) | 0 | 0 | 0 | ||||||
| 07/09/2026-07/15/2026 | Avg Flow (cfs) | 175.3 | 8578.2 | 7079.6 | 8624.4 | 19879.3 | 19879.3 | 9804.9 | 612.9 | |
| 07/09/2026-07/15/2026 | Avg Water Temp (F) | 70.7 | 70.7 | 69.4 | 72.1 | |||||
| 07/09/2026-07/15/2026 | Avg Turbidity (NTU) | |||||||||
| source of Avg Flow (cfs) | Butte Creek nr Chico (CDEC:BCK) | Colousa (CDEC:COL) | Wilkins Slough (CDEC:WLK) | Boyd's Landing (CDEC:FSB) | Verona (CDEC:VON) | Freeport (CDEC:FPT) | Freeport (CDEC:FPT) | Delta OutFlow (CDEC:DTO) | Vernalis (CDEC:VNS) | |
| source of Avg Water Temp (F) | Butte Creek | Tisdale Weir | Knights Landing | Lower Feather River | Lower Sacramento River | Hood (CDEC:SRH) | Hood (CDEC:SRH) | Chipps Island Trawls | Vernalis (CDEC:VNS) | |
| source of Avg Turbidity (NTU) | Butte Creek | Tisdale Weir | Knights Landing | Lower Feather River | Lower Sacramento River | Sacramento Trawls | Sacramento Trawls | Chipps Island Trawls | Mossdale Trawls |
- Butte Creek Diversion and RST: Preliminary data from CDFW via CalFish; subject to revision.
- Tisdale Weir RST: Preliminary data from CDFW via CalFish and CDEC; subject to revision.
- Knights Landing RST: Preliminary data from CDFW via CalFish and CDEC; subject to revision. Turbidity is a discrete measure. KNL measured in FTU which should be roughly equivalent to NTU.
- Lower Feather River RST: Preliminary data from CDFW via CalFish; subject to revision.
- Lower Sacramento River RST: Preliminary data from CDFW via CalFish; subject to revision.
- Sacramento Trawls (@ Sherwood Harbor): Preliminary data from USFWS Lodi and CDEC; subject to revision.
- Sacramento Beach Seines: Preliminary data from USFWS Lodi and CDEC; subject to revision.
- Chipps Island Trawls: Preliminary data from USFWS Lodi and CDEC; subject to revision.
- Mossdale Trawls: Preliminary data from USFWS Lodi and CDEC; subject to revision.
- Averages: calculated for all non-null data points within the 7 day reporting period.
Historical Migration Pattern for "Today"
| Species | Red Bluff Diversion Dam | Tisdale RST | Knights Landing RST | Sac Trawl (Sherwood) Catch Index | Chipps Island Trawl Catch Index | Salvage |
|---|---|---|---|---|---|---|
| Chinook, LAD Winter-run, Unclipped | 0.2% (0.1%,0.3%) BY: 2015 - 2025 |
0.0% (0.0%,0.0%) BY: 2015 - 2025 |
0.0% (0.0%,0.0%) BY: 2015 - 2025 |
0.0% (0.0%,0.0%) BY: 2015 - 2025 |
0.0% (0.0%,0.0%) BY: 2015 - 2025 |
100.0% (100.0%,100.0%) WY: 2016 - 2025 |
| Chinook, LAD Spring-run, Unclipped | 100.0% (100.0%,100.0%) BY: 2015 - 2024 |
100.0% (100.0%,100.0%) BY: 2015 - 2024 |
100.0% (100.0%,100.0%) BY: 2015 - 2024 |
100.0% (100.0%,100.0%) BY: 2015 - 2024 |
100.0% (100.0%,100.0%) BY: 2015 - 2024 |
100.0% (100.0%,100.0%) WY: 2016 - 2025 |
| Steelhead, Unclipped (January-December) | 51.8% (37.2%,66.3%) BY: 2015 - 2025 |
87.9% (69.1%,106.7%) BY: 2015 - 2025 |
83.4% (67.7%,99.2%) BY: 2015 - 2025 |
98.1% (93.9%,102.4%) BY: 2015 - 2025 |
93.5% (87.5%,99.5%) BY: 2015 - 2025 |
|
| Chinook, DNA Winter-run, Unclipped (Water Year) | 100.0% (100.0%,100.0%) WY: 2016 - 2025 |
|||||
| Steelhead, Unclipped (Water Year) | 99.9% (99.6%,100.2%) WY: 2016 - 2025 |
Delta STARS Estimates
Current estimates generated by the Delta STARS tool. STARS Predicted Survival, Travel-Time and Routing for Late-Fall Run and Winter Run Chinook. Delta STARS developed by USGS Quantitative Fisheries Ecology Section and deployed by SacPAS.
| Stock | Date | Route | Parameter | Estimate | Lower 80% Credible Limit | Upper 80% Credible Limit |
|---|---|---|---|---|---|---|
| Winter Chinook | 2026-07-22 | Overall | Median Travel Time | 6.206 | 5.4807 | 6.5964 |
| Winter Chinook | 2026-07-22 | Overall | Survival | 0.0012163 | 3.4358e-7 | 6.5225e-4 |
| Winter Chinook | 2026-07-22 | Sacramento River | Median Travel Time | 5.772 | 5 | 6 |
| Winter Chinook | 2026-07-22 | Sacramento River | Routing Probability | 0.61001 | 0.58014 | 0.63909 |
| Winter Chinook | 2026-07-22 | Sacramento River | Survival | 0.001212 | 1.7559e-7 | 5.3819e-4 |
| Winter Chinook | 2026-07-22 | Yolo Bypass | Median Travel Time | 10.056 | 9 | 11 |
| Winter Chinook | 2026-07-22 | Yolo Bypass | Routing Probability | 0 | 0 | 0 |
| Winter Chinook | 2026-07-22 | Yolo Bypass | Survival | 0.30604 | 0.0072479 | 0.72 |
| Winter Chinook | 2026-07-22 | Sutter Slough | Median Travel Time | 6.011 | 5 | 6 |
| Winter Chinook | 2026-07-22 | Sutter Slough | Routing Probability | 0.13546 | 0.11575 | 0.15595 |
| Winter Chinook | 2026-07-22 | Sutter Slough | Survival | 0.0019626 | 5.0777000000000005e-07 | 0.0010986 |
| Winter Chinook | 2026-07-22 | Steamboat Slough | Median Travel Time | 5.6 | 5 | 6 |
| Winter Chinook | 2026-07-22 | Steamboat Slough | Routing Probability | 0.12921 | 0.11206 | 0.14651 |
| Winter Chinook | 2026-07-22 | Steamboat Slough | Survival | 9.6308e-4 | 1.071e-7 | 4.5331e-4 |
| Winter Chinook | 2026-07-22 | Interior Delta | Median Travel Time | 9.155 | 8 | 10 |
| Winter Chinook | 2026-07-22 | Interior Delta | Routing Probability | 0.12532 | 0.10273 | 0.14826 |
| Winter Chinook | 2026-07-22 | Interior Delta | Survival | 6.2223e-4 | 3.8606e-8 | 2.871e-4 |
| Late-fall Chinook | 2026-07-22 | Overall | Median Travel Time | 8.9276 | 5.7948 | 14.064 |
| Late-fall Chinook | 2026-07-22 | Overall | Survival | 0.51253 | 0.37359 | 0.64159 |
| Late-fall Chinook | 2026-07-22 | Delta Cross Channel | Median Travel Time | NA | NA | NA |
| Late-fall Chinook | 2026-07-22 | Delta Cross Channel | Routing Probability | 0 | 0 | 0 |
| Late-fall Chinook | 2026-07-22 | Delta Cross Channel | Survival | NA | NA | NA |
| Late-fall Chinook | 2026-07-22 | Georgiana Slough | Median Travel Time | 12.647 | 7.0744 | 24.537 |
| Late-fall Chinook | 2026-07-22 | Georgiana Slough | Routing Probability | 0.2 | 0.2 | 0.6 |
| Late-fall Chinook | 2026-07-22 | Georgiana Slough | Survival | 0.26127 | 0.1178 | 0.42335 |
| Late-fall Chinook | 2026-07-22 | Sacramento River | Median Travel Time | 7.5208 | 4.4653 | 14.095 |
| Late-fall Chinook | 2026-07-22 | Sacramento River | Routing Probability | 0.4 | 0.2 | 0.8 |
| Late-fall Chinook | 2026-07-22 | Sacramento River | Survival | 0.62402 | 0.49939 | 0.72991 |
| Late-fall Chinook | 2026-07-22 | Sutter and Steamboat Slough | Median Travel Time | 7.948 | 4.5117 | 15.832 |
| Late-fall Chinook | 2026-07-22 | Sutter and Steamboat Slough | Routing Probability | 0.4 | 0.2 | 0.6 |
| Late-fall Chinook | 2026-07-22 | Sutter and Steamboat Slough | Survival | 0.54652 | 0.37727 | 0.66863 |
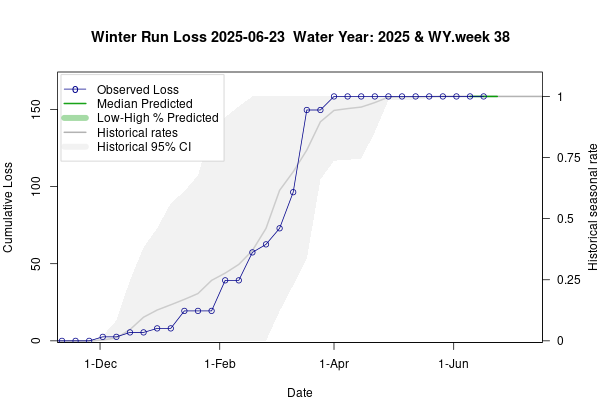
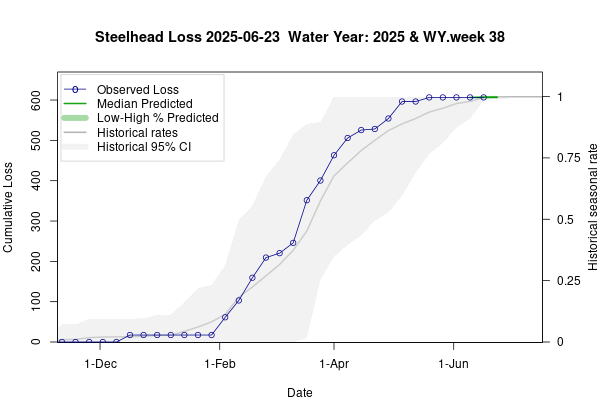
Loss&Salvage Predictor Estimates
Current estimates generated by the Loss and Salvage Predictor tool. The tool predicts loss and/or salvage of endangered steelhead and winter run Chinook salmon at the CVP and SWP pumping facilities at the southern end of the Sacramento-San Joaquin Delta.
For model details and calibration methods see Tillotson et al. (2022).
Tillotson MD, Hassrick J, Collins AL, Corey P. 2022. Machine Learning Forecasts to Reduce Risk of Entrainment Loss of Endangered Salmonids at Large-Scale Water Diversions in the Sacramento-San Joaquin Delta, California. San Francisco Estuary and Watershed Science.
Current Conditions
| Parameter Token | Parameter Description | Water Year | Week | Week Type | Value |
|---|---|---|---|---|---|
| temp.mal | Water Temperature °C, Mallard Island (MAL) from CDEC | 2026 | 38 | Data | 21 |
| precip | Precipitation Inches, 5 day running sum, Stockton Fire Station (SFS) from CDEC | 2026 | 38 | Data | 0 |
| om.sum | OMR Flows CFS, sum of tidally-filtered discharge at Middle River and Bacon Island from USGS | 2026 | 38 | Data | -2440 |
| sac | Sacramento Flows CFS, Freeport (FPT) from CDEC | 2026 | 38 | Data | 14281 |
| dcc | DCC Gate Status from BOR | 2026 | 38 | Data | closed |
| sjr | San Joaquin River Flow CFS, Vernalis (VNS) from CDEC | 2026 | 38 | Data | 1410 |
| export | Exports CFS, sum of Pumping Discharge at HRO and TRP from CDEC | 2026 | 38 | Data | 1075 |
| steelhead.pw | Steelhead Previous Week | 2026 | 38 | Data | 0 |
| winter.pw | Winter Chinook Previous Week | 2026 | 38 | Data | 0 |
| temp.mal | Water Temperature °C, Mallard Island (MAL) from CDEC | 2026 | 39 | Forecast | 21 |
| precip | Precipitation Inches, 5 day running sum, Stockton Fire Station (SFS) from CDEC | 2026 | 39 | Forecast | 0 |
| om.sum | OMR Flows CFS, sum of tidally-filtered discharge at Middle River and Bacon Island from USGS | 2026 | 39 | Forecast | -2440 |
| sac | Sacramento Flows CFS, Freeport (FPT) from CDEC | 2026 | 39 | Forecast | 14281 |
| dcc | DCC Gate Status from BOR | 2026 | 39 | Forecast | closed |
| sjr | San Joaquin River Flow CFS, Vernalis (VNS) from CDEC | 2026 | 39 | Forecast | 1410 |
| export | Exports CFS, sum of Pumping Discharge at HRO and TRP from CDEC | 2026 | 39 | Forecast | 1075 |
| steelhead.pw | Steelhead Previous Week | 2026 | 39 | Forecast | 0 |
| winter.pw | Winter Chinook Previous Week | 2026 | 39 | Forecast | 0 |
| Parameter Token | Parameter Description | Water Year | Week | Value |
|---|---|---|---|---|
| Steelhead.Low | Steelhead Predicted loss, 90% CI Low | 2026 | 38 | 0 |
| Steelhead.Median | Steelhead Predicted loss, Median | 2026 | 38 | 0 |
| Steelhead.High | Steelhead Predicted loss, 90% CI High | 2026 | 38 | 11 |
| Winter.Run.Low | Winter Chinook Predicted loss, 90% CI Low | 2026 | 38 | 0 |
| Winter.Run.Median | Winter Chinook Predicted loss, Median | 2026 | 38 | 0 |
| Winter.Run.High | Winter Chinook Predicted loss, 90% CI High | 2026 | 38 | 0 |
| Steelhead.Observed.loss | Steelhead Observed loss | 2026 | 38 | 0 |
| Winter.Run.Observed.loss | Winter Chinook Observed loss | 2026 | 38 | 0 |
| Steelhead.Cumulative.loss | Steelhead Observed Cumulative loss | 2026 | 38 | 265 |
| Winter.Run.Cumulative.loss | Winter Observed Chinook Cumulative loss | 2026 | 38 | 111 |
| Steelhead.Low | Steelhead Predicted loss, 90% CI Low | 2026 | 39 | 0 |
| Steelhead.Median | Steelhead Predicted loss, Median | 2026 | 39 | 0 |
| Steelhead.High | Steelhead Predicted loss, 90% CI High | 2026 | 39 | 8 |
| Winter.Run.Low | Winter Chinook Predicted loss, 90% CI Low | 2026 | 39 | 0 |
| Winter.Run.Median | Winter Chinook Predicted loss, Median | 2026 | 39 | 0 |
| Winter.Run.High | Winter Chinook Predicted loss, 90% CI High | 2026 | 39 | 0 |
| Steelhead.Observed.loss | Steelhead Observed loss | 2026 | 39 | NA |
| Winter.Run.Observed.loss | Winter Chinook Observed loss | 2026 | 39 | NA |
| Steelhead.Cumulative.loss | Steelhead Observed Cumulative loss | 2026 | 39 | 265 |
| Winter.Run.Cumulative.loss | Winter Observed Chinook Cumulative loss | 2026 | 39 | 111 |
OMRI Scenarios
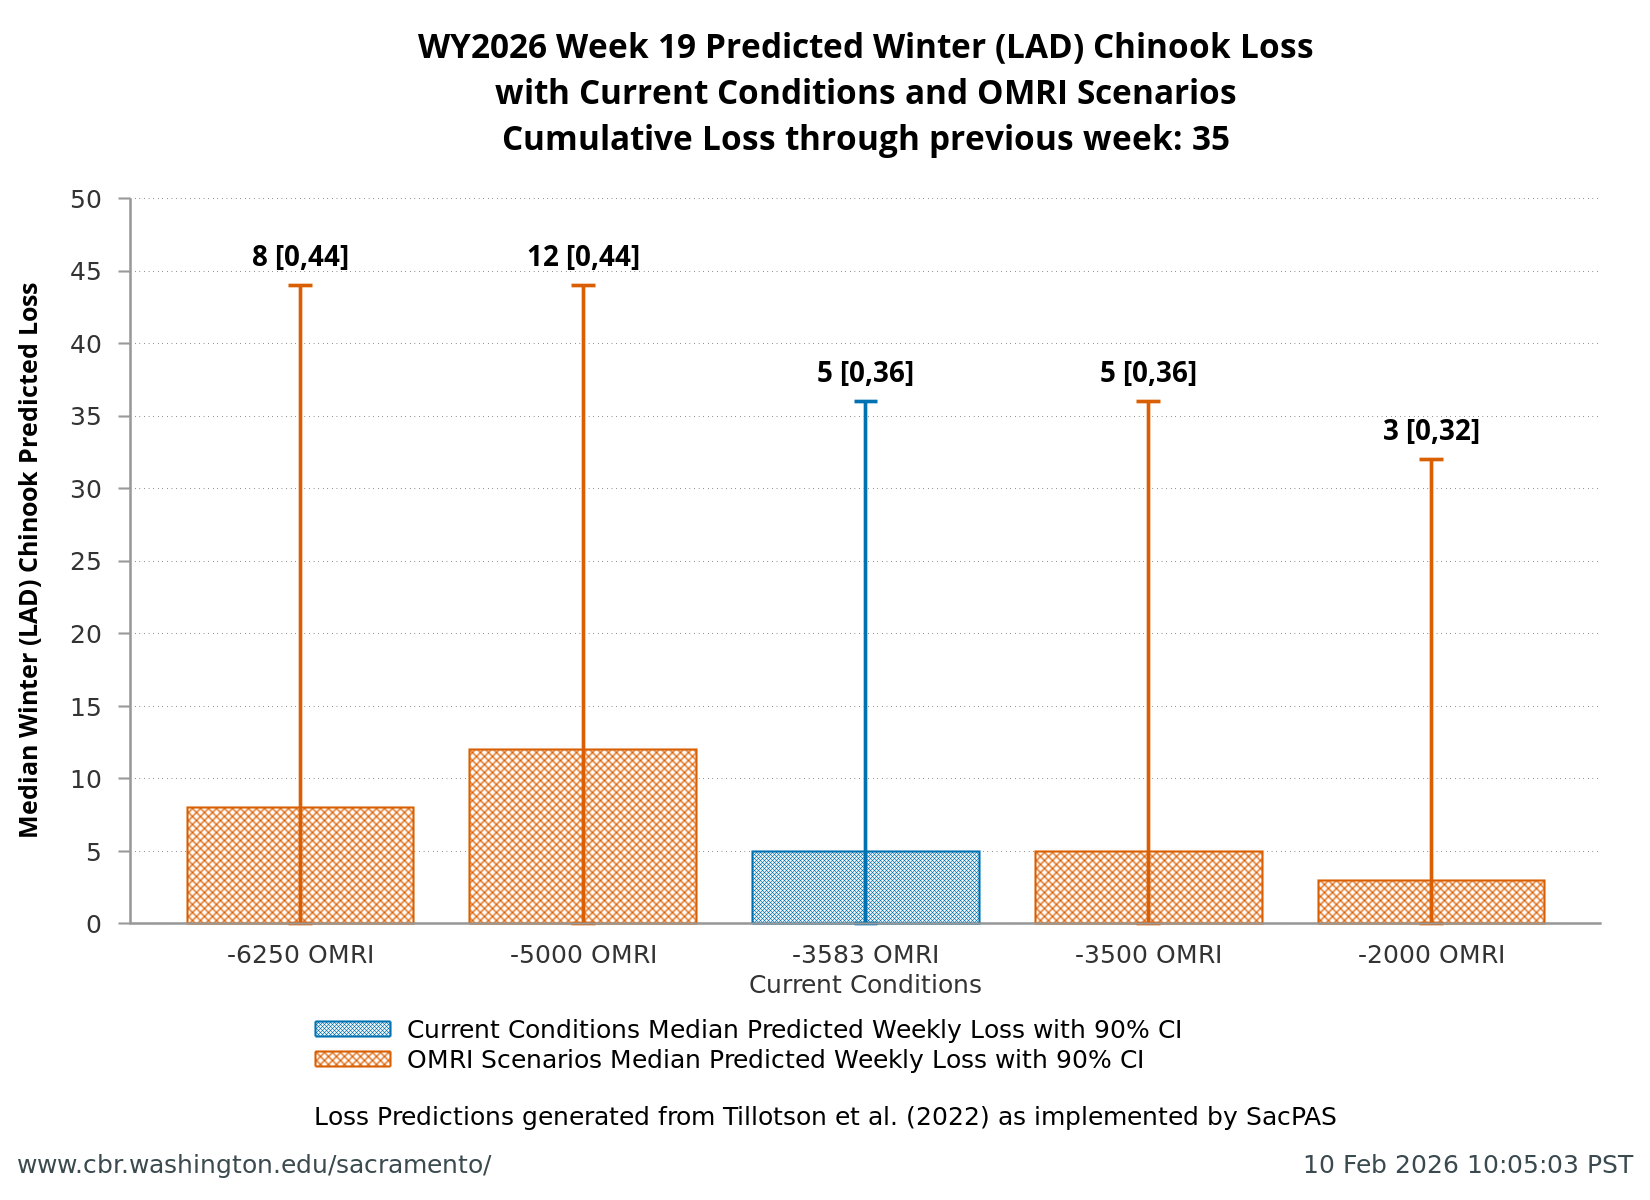
| Water Year (WY) | WY Week | Prediction Type | OMRI Value | Winter Chinook Predicted loss, 90% CI Low | Winter Chinook Predicted loss, Median | Winter Chinook Predicted loss, 90% CI High | Winter Observed Chinook Cumulative loss |
|---|---|---|---|---|---|---|---|
| 2026 | 39 | Alternative | -6250 | 0 | 0 | 0 | 111 |
| 2026 | 39 | Alternative | -5000 | 0 | 0 | 0 | 111 |
| 2026 | 39 | Alternative | -3500 | 0 | 0 | 0 | 111 |
| 2026 | 39 | Current Conditions | -2363 | 0 | 0 | 0 | 111 |
| 2026 | 39 | Alternative | -2000 | 0 | 0 | 0 | 111 |
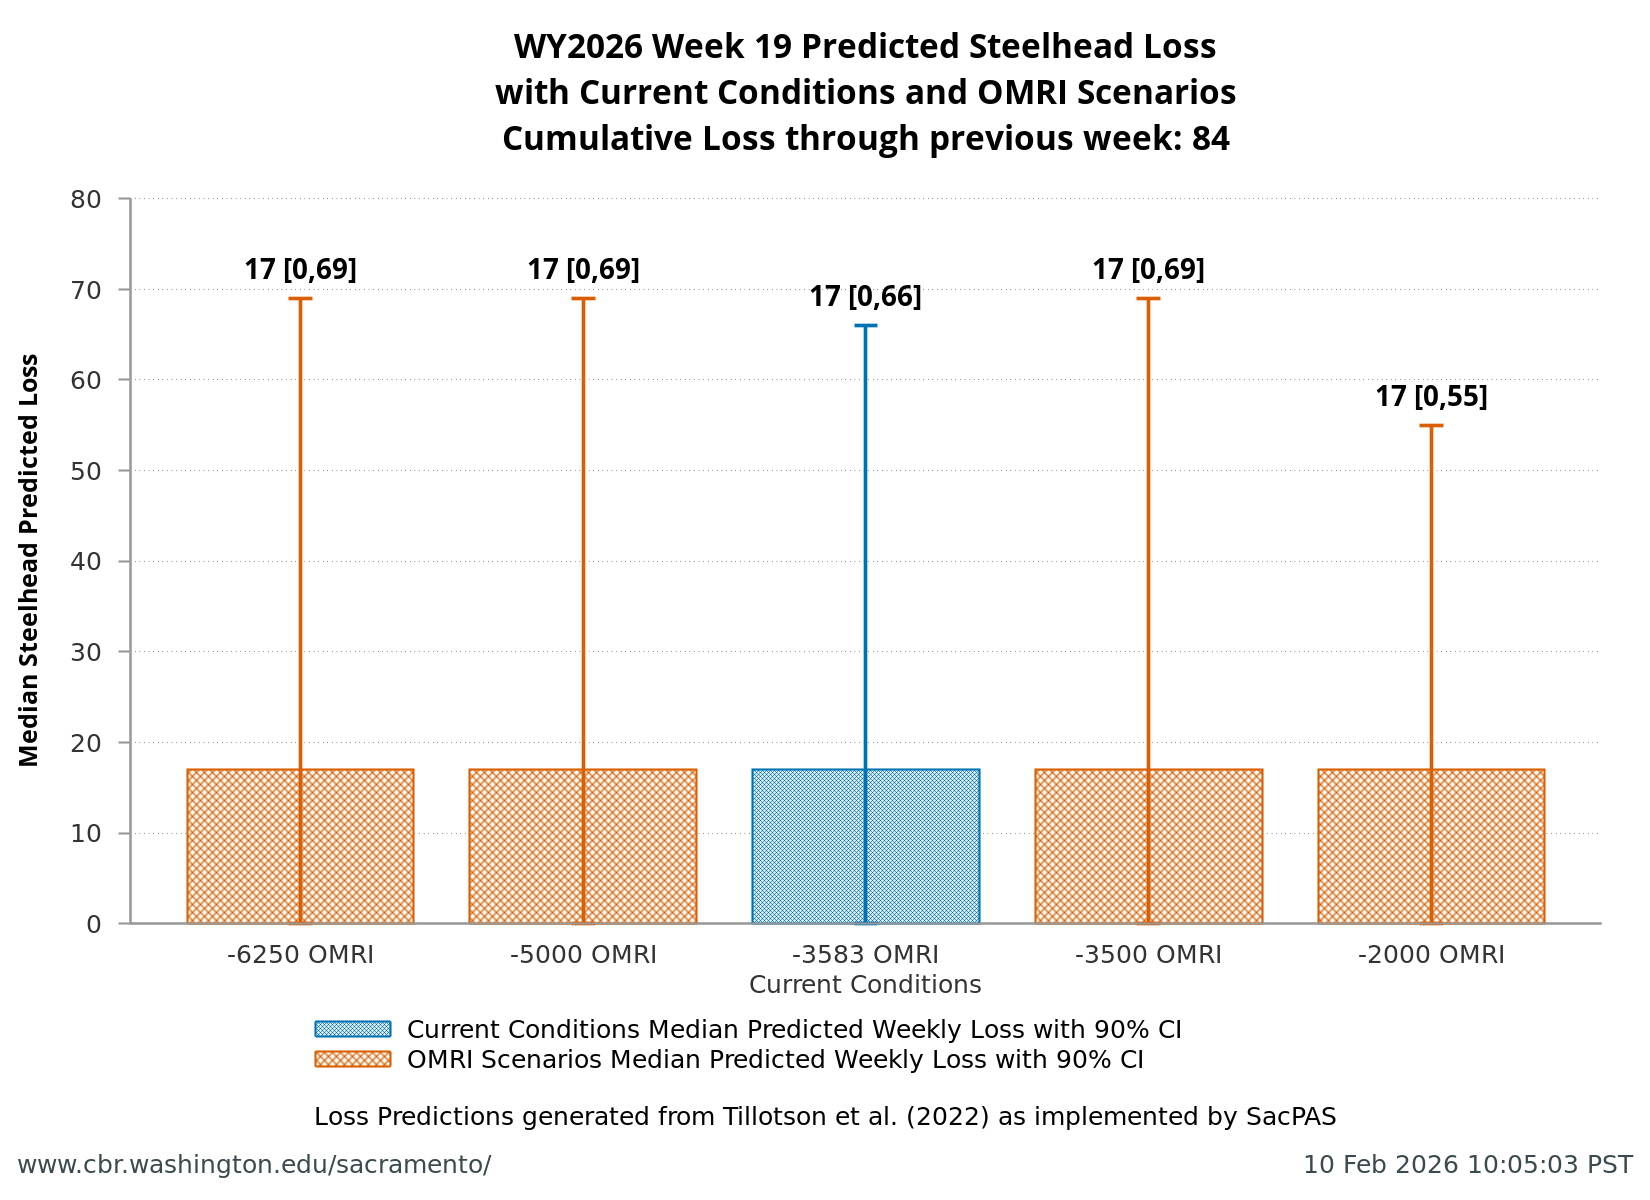
| Water Year (WY) | WY Week | Prediction Type | OMRI Value | Steelhead Predicted loss, 90% CI Low | Steelhead Predicted loss, Median | Steelhead Predicted loss, 90% CI High | Steelhead Observed Cumulative loss |
|---|---|---|---|---|---|---|---|
| 2026 | 39 | Alternative | -6250 | 0 | 0 | 11 | 265 |
| 2026 | 39 | Alternative | -5000 | 0 | 0 | 17 | 265 |
| 2026 | 39 | Alternative | -3500 | 0 | 0 | 13 | 265 |
| 2026 | 39 | Current Conditions | -2363 | 0 | 0 | 4 | 265 |
| 2026 | 39 | Alternative | -2000 | 0 | 0 | 4 | 265 |
Spring Surrogates
| Type | Hatchery | Release Type | Release Start | Release End | Race | Total # of Fish Released | # of CWT Fish Released | Tag Codes | Confirmed Loss | % Loss of CWT Number Released | First Loss | Last Loss | Confirmed Loss CWT Tag Codes |
|---|---|---|---|---|---|---|---|---|---|---|---|---|---|
| Yearling | Coleman NFH | Experimental | 2025-11-17 | 2025-11-17 | Late-Fall | 75,119 | 75,119 | 056810 | 0.00 | 0.00% | |||
| Yearling | Coleman NFH | Experimental | 2025-12-22 | 2025-12-22 | Late-Fall | 60,873 | 60,873 | 056813 | 257.31 | 0.42% | 2025-12-30 | 2026-01-22 | 056813 |
| Yearling | Coleman NFH | Experimental | 2026-01-08 | 2026-01-08 | Late-Fall | 57,109 | 57,109 | 056816 | 35.06 | 0.06% | 2026-01-26 | 2026-02-20 | 056816 |
| Yearling | Coleman NFH | Production | 2025-11-13 | 2025-11-13 | Late-Fall | 143,346 | 143,346 | 056808, 056809 | 8.65 | 0.01% | 2025-12-26 | 2025-12-31 | 056808, 056809 |
| Yearling | Coleman NFH | Production | 2025-12-17 | 2025-12-17 | Late-Fall | 468,876 | 468,876 | 053700, 056806, 056811, 056812, 056814, 056815, 056817 | 774.10 | 0.17% | 2025-12-25 | 2026-03-23 | 053700, 056806, 056811, 056812, 056814, 056815, 056817 |
| Young-of-year | Feather River Hatchery | Production | 2026-03-18 | 2026-03-18 | Spring | 985,324 | 985,324 | 063229, 063227 | 0.00 | 0.00% | |||
| Young-of-year | Feather River Hatchery | Production | 2026-03-19 | 2026-03-19 | Spring | 1,048,948 | 1,048,948 | 063036, 063236, 063239 | 0.00 | 0.00% | |||
| Young-of-year | Feather River Hatchery | Production | 2026-03-23 | 2026-03-23 | Spring | 488,217 | 488,217 | 062858, 063234 | 0.00 | 0.00% |
Single-Year Loss Thresholds
Single-Year Loss Thresholds
- Natural Winter-Run Chinook Salmon (loss threshold = 10575; 1.0% of JPE)
- Hatchery Winter-Run Chinook Salmon, releases from Livingston Stone NFH (loss threshold = 1301; 1.0% of JPE)
- Natural Central Valley Steelhead (loss = 5294; Incidental Take Limit (ITL) in 2024 NMFS BiOp)
- Hatchery Central Valley Steelhead (loss threshold is 1% of JPE based on estimated survivals using forecasted water year types and hatchery releases to-date)
Loss Summary Table
| Data Item | DNA Winter-run Chinook | LAD Winter-run Chinook | LSNFH Hatchery CWT Winter-run Chinook | Natural Steelhead | Hatchery Steelhead |
|---|---|---|---|---|---|
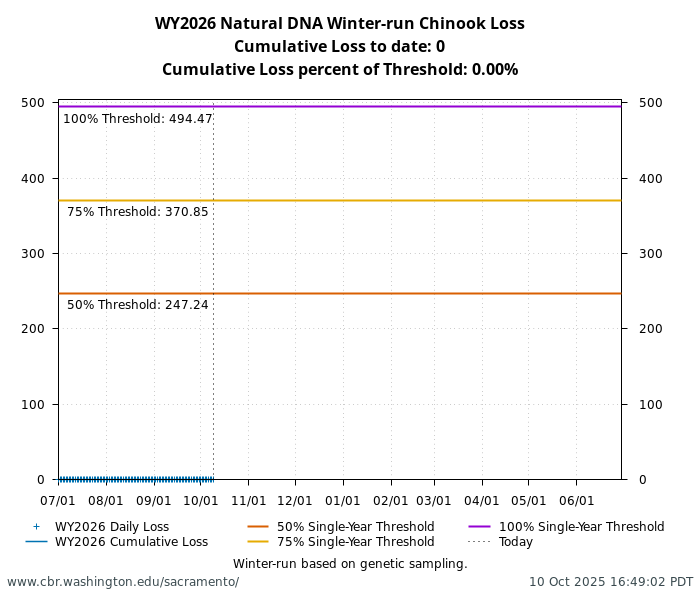
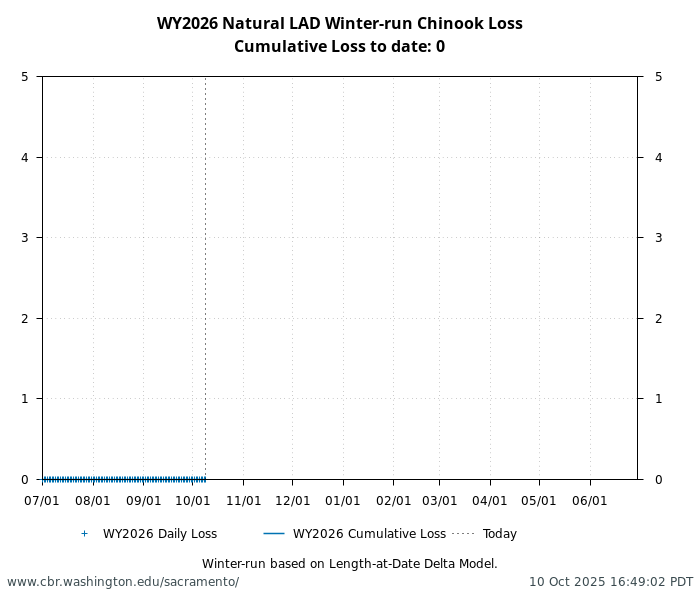
| Loss Total Last 1-7 days (07/16/2026-07/22/2026) | 0 | 0 | 0 | 0 | 0 |
| Loss Total Last 8-14 days (07/09/2026-07/15/2026) | 0 | 0 | 0 | 0 | 0 |
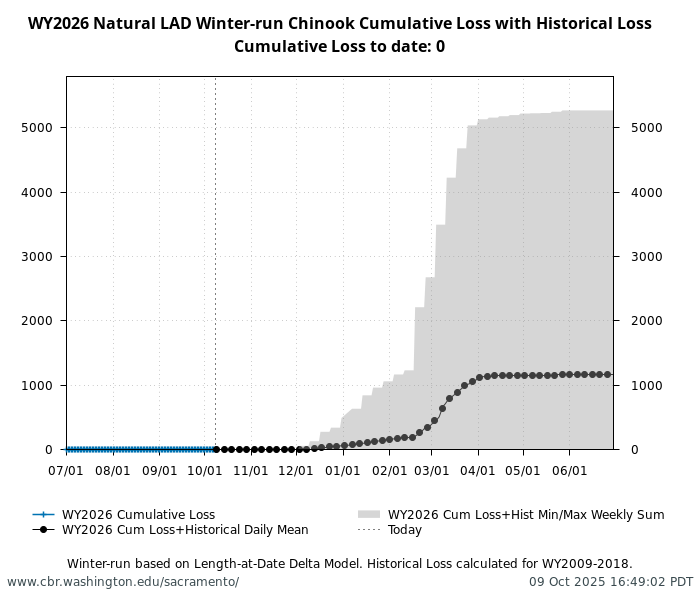
| Cumulative Loss Total (07/01/2025-06/30/2026) | 45.42 | 111.16 | 57.91 | 264.64 | 1898.37 |
| Cumulative Loss Percent of Threshold (07/01/2025-06/30/2026) | 0.43% | NA | 4.45% | 5.00% | 29.02% |
| Single-Year Loss Threshold | 10575 | NA | 1301 | 5294 | 6541 |
Natural DNA Winter-Run Chinook Salmon Loss Figure
Natural LAD Winter-Run Chinook Salmon Loss Figures
LSNFH Hatchery CWT Winter-Run Chinook Salmon Loss Figure
LSNFH Hatchery CWT Winter-Run Chinook Salmon Releases
| Release Start | Release End | CWT Tag Race | Hatchery | Release Site | Release Type | CWT Number Released |
% CWT Marked of Total Number Released |
CWT Tagcodes |
|---|---|---|---|---|---|---|---|---|
| 2026-02-18 | 2026-02-18 | Winter | Livingston Stone NFH | Sacramento River at John F. Reginato River Access | Production | 466344 | 100.0 | 053800, 056770, 056788, 056789 |
Natural Central Valley Steelhead Loss Figures
Hatchery Central Valley Steelhead Loss Figure
Hatchery Central Valley Steelhead Releases and JPE
| Start Date | End Date | Hatchery | Mark Type | Marked | Total Released | Release Type | WSI Basin | WSI Prob Exceedance Percent | WSI Rel Month Forecast | WSI Water Year Type | WY Type-applied Survival Estimate | Juvenile Production Estimate | Surv Est Range Source |
|---|---|---|---|---|---|---|---|---|---|---|---|---|---|
| 2025-11-10 | 2025-11-12 | NIM | Ad-clip | 233109 | 233109 | Production | Sacramento Valley | NA using Surv Est Range Avg | 0.72 | 167838 | Brodsky et al. (2020) | ||
| 2025-12-15 | 2025-12-16 | CNFH | Ad-clip | 555720 | 555720 | Production | Sacramento Valley | 50 | 8.09 | Above Normal | 0.38 | 211174 | Sandstrom et al. (2020) |
| 2025-12-17 | 2025-12-18 | CNFH | Ad-clip | 90019 | 90019 | Production | Sacramento Valley | 50 | 8.09 | Above Normal | 0.38 | 34207 | Sandstrom et al. (2020) |
| 2026-01-06 | 2026-01-27 | FRH | Ad-clip | 376640 | 376640 | Production | Sacramento Valley | 50 | 9.08 | Above Normal | 0.36 | 135590 | Kurth (2013) |
| 2026-01-09 | 2026-01-27 | FRH | Ad-clip | 117715 | 117715 | Production | Sacramento Valley | 50 | 9.08 | Above Normal | 0.36 | 42377 | Kurth (2013) |
| 2026-02-17 | 2026-02-17 | MOK | Ad-clip | 39130 | 39130 | Experimental | San Joaquin Valley | 75 | 1.95 | Critical | 0.25 | 9783 | Del Real et al. (2012) |
| 2026-02-18 | 2026-02-18 | MOK | Ad-clip | 39131 | 39131 | Experimental | San Joaquin Valley | 75 | 1.95 | Critical | 0.25 | 9783 | Del Real et al. (2012) |
| 2026-03-18 | 2026-03-18 | MOK | Ad-clip | 41550 | 41550 | Production | San Joaquin Valley | 75 | 2.24 | Dry | 0.27 | 11219 | Del Real et al. (2012) |
| 2026-03-19 | 2026-03-19 | MOK | Ad-clip | 42150 | 42150 | Production | San Joaquin Valley | 75 | 2.24 | Dry | 0.27 | 11381 | Del Real et al. (2012) |
| 2026-04-16 | 2026-04-16 | MOK | Ad-clip | 83110 | 83110 | Production | San Joaquin Valley | 75 | 1.88 | Critical | 0.25 | 20778 | Del Real et al. (2012) |
Daily Loss Table
| Date | DNA Winter-run Chinook : Daily Loss | DNA Winter-run Chinook : Cum Loss | LAD Winter-run Chinook : Daily Loss | LAD Winter-run Chinook : Cum Loss | LSNFH Hatchery CWT Winter-run Chinook : Daily Loss | LSNFH Hatchery CWT Winter-run Chinook : Cum Loss | Natural Steelhead : Daily Loss | Natural Steelhead : Cum Loss | Hatchery Steelhead : Daily Loss | Hatchery Steelhead : Cum Loss |
|---|---|---|---|---|---|---|---|---|---|---|
| Date | DNA Winter-run Chinook : Daily Loss | DNA Winter-run Chinook : Cum Loss | LAD Winter-run Chinook : Daily Loss | LAD Winter-run Chinook : Cum Loss | LSNFH Hatchery CWT Winter-run Chinook : Daily Loss | LSNFH Hatchery CWT Winter-run Chinook : Cum Loss | Natural Steelhead : Daily Loss | Natural Steelhead : Cum Loss | Hatchery Steelhead : Daily Loss | Hatchery Steelhead : Cum Loss |
| 2026-06-30 | 0 | 45.42 | 0 | 111.16 | 0 | 57.91 | 0 | 264.64 | 0 | 1898.37 |
| 2026-06-29 | 0 | 45.42 | 0 | 111.16 | 0 | 57.91 | 0 | 264.64 | 0 | 1898.37 |
| 2026-06-28 | 0 | 45.42 | 0 | 111.16 | 0 | 57.91 | 0 | 264.64 | 0 | 1898.37 |
| 2026-06-27 | 0 | 45.42 | 0 | 111.16 | 0 | 57.91 | 0 | 264.64 | 0 | 1898.37 |
| 2026-06-26 | 0 | 45.42 | 0 | 111.16 | 0 | 57.91 | 0 | 264.64 | 0 | 1898.37 |
| 2026-06-25 | 0 | 45.42 | 0 | 111.16 | 0 | 57.91 | 0 | 264.64 | 0 | 1898.37 |
| 2026-06-24 | 0 | 45.42 | 0 | 111.16 | 0 | 57.91 | 0 | 264.64 | 0 | 1898.37 |
| 2026-06-23 | 0 | 45.42 | 0 | 111.16 | 0 | 57.91 | 0 | 264.64 | 0 | 1898.37 |
| 2026-06-22 | 0 | 45.42 | 0 | 111.16 | 0 | 57.91 | 0 | 264.64 | 0 | 1898.37 |
| 2026-06-21 | 0 | 45.42 | 0 | 111.16 | 0 | 57.91 | 0 | 264.64 | 0 | 1898.37 |
| 2026-06-20 | 0 | 45.42 | 0 | 111.16 | 0 | 57.91 | 0 | 264.64 | 0 | 1898.37 |
| 2026-06-19 | 0 | 45.42 | 0 | 111.16 | 0 | 57.91 | 0 | 264.64 | 0 | 1898.37 |
| 2026-06-18 | 0 | 45.42 | 0 | 111.16 | 0 | 57.91 | 0 | 264.64 | 0 | 1898.37 |
| 2026-06-17 | 0 | 45.42 | 0 | 111.16 | 0 | 57.91 | 0 | 264.64 | 0 | 1898.37 |
| 2026-06-16 | 0 | 45.42 | 0 | 111.16 | 0 | 57.91 | 0 | 264.64 | 0 | 1898.37 |
| 2026-06-15 | 0 | 45.42 | 0 | 111.16 | 0 | 57.91 | 0 | 264.64 | 0 | 1898.37 |
| 2026-06-14 | 0 | 45.42 | 0 | 111.16 | 0 | 57.91 | 0 | 264.64 | 0 | 1898.37 |
| 2026-06-13 | 0 | 45.42 | 0 | 111.16 | 0 | 57.91 | 0 | 264.64 | 0 | 1898.37 |
| 2026-06-12 | 0 | 45.42 | 0 | 111.16 | 0 | 57.91 | 0 | 264.64 | 0 | 1898.37 |
| 2026-06-11 | 0 | 45.42 | 0 | 111.16 | 0 | 57.91 | 0 | 264.64 | 0 | 1898.37 |
| 2026-06-10 | 0 | 45.42 | 0 | 111.16 | 0 | 57.91 | 0 | 264.64 | 0 | 1898.37 |
| 2026-06-09 | 0 | 45.42 | 0 | 111.16 | 0 | 57.91 | 0 | 264.64 | 0 | 1898.37 |
| 2026-06-08 | 0 | 45.42 | 0 | 111.16 | 0 | 57.91 | 0 | 264.64 | 0 | 1898.37 |
| 2026-06-07 | 0 | 45.42 | 0 | 111.16 | 0 | 57.91 | 0 | 264.64 | 0 | 1898.37 |
| 2026-06-06 | 0 | 45.42 | 0 | 111.16 | 0 | 57.91 | 0 | 264.64 | 0 | 1898.37 |
| 2026-06-05 | 0 | 45.42 | 0 | 111.16 | 0 | 57.91 | 0 | 264.64 | 0 | 1898.37 |
| 2026-06-04 | 0 | 45.42 | 0 | 111.16 | 0 | 57.91 | 0 | 264.64 | 0 | 1898.37 |
| 2026-06-03 | 0 | 45.42 | 0 | 111.16 | 0 | 57.91 | 0 | 264.64 | 0 | 1898.37 |
| 2026-06-02 | 0 | 45.42 | 0 | 111.16 | 0 | 57.91 | 0 | 264.64 | 0 | 1898.37 |
| 2026-06-01 | 0 | 45.42 | 0 | 111.16 | 0 | 57.91 | 0 | 264.64 | 0 | 1898.37 |
| 2026-05-31 | 0 | 45.42 | 0 | 111.16 | 0 | 57.91 | 0 | 264.64 | 0 | 1898.37 |
| 2026-05-30 | 0 | 45.42 | 0 | 111.16 | 0 | 57.91 | 0 | 264.64 | 0 | 1898.37 |
| 2026-05-29 | 0 | 45.42 | 0 | 111.16 | 0 | 57.91 | 0 | 264.64 | 0 | 1898.37 |
| 2026-05-28 | 0 | 45.42 | 0 | 111.16 | 0 | 57.91 | 0 | 264.64 | 0 | 1898.37 |
| 2026-05-27 | 0 | 45.42 | 0 | 111.16 | 0 | 57.91 | 0 | 264.64 | 0 | 1898.37 |
| 2026-05-26 | 0 | 45.42 | 0 | 111.16 | 0 | 57.91 | 0 | 264.64 | 0 | 1898.37 |
| 2026-05-25 | 0 | 45.42 | 0 | 111.16 | 0 | 57.91 | 0 | 264.64 | 0 | 1898.37 |
| 2026-05-24 | 0 | 45.42 | 0 | 111.16 | 0 | 57.91 | 0 | 264.64 | 0 | 1898.37 |
| 2026-05-23 | 0 | 45.42 | 0 | 111.16 | 0 | 57.91 | 0 | 264.64 | 0 | 1898.37 |
| 2026-05-22 | 0 | 45.42 | 0 | 111.16 | 0 | 57.91 | 0 | 264.64 | 0 | 1898.37 |
| 2026-05-21 | 0 | 45.42 | 0 | 111.16 | 0 | 57.91 | 2.72 | 264.64 | 0.68 | 1898.37 |
| 2026-05-20 | 0 | 45.42 | 0 | 111.16 | 0 | 57.91 | 0 | 261.92 | 0 | 1897.69 |
| 2026-05-19 | 0 | 45.42 | 0 | 111.16 | 0 | 57.91 | 0 | 261.92 | 0 | 1897.69 |
| 2026-05-18 | 0 | 45.42 | 0 | 111.16 | 0 | 57.91 | 2.72 | 261.92 | 0 | 1897.69 |
| 2026-05-17 | 0 | 45.42 | 0 | 111.16 | 0 | 57.91 | 0 | 259.2 | 5.44 | 1897.69 |
| 2026-05-16 | 0 | 45.42 | 0 | 111.16 | 0 | 57.91 | 0 | 259.2 | 0 | 1892.25 |
| 2026-05-15 | 0 | 45.42 | 0 | 111.16 | 0 | 57.91 | 2.72 | 259.2 | 0 | 1892.25 |
| 2026-05-14 | 0 | 45.42 | 0 | 111.16 | 0 | 57.91 | 2.72 | 256.48 | 2.72 | 1892.25 |
| 2026-05-13 | 0 | 45.42 | 0 | 111.16 | 0 | 57.91 | 0 | 253.76 | 0 | 1889.53 |
| 2026-05-12 | 0 | 45.42 | 0 | 111.16 | 0 | 57.91 | 0 | 253.76 | 0 | 1889.53 |
| 2026-05-11 | 0 | 45.42 | 0 | 111.16 | 0 | 57.91 | 2.72 | 253.76 | 0 | 1889.53 |
| 2026-05-10 | 0 | 45.42 | 0 | 111.16 | 0 | 57.91 | 0 | 251.04 | 0 | 1889.53 |
| 2026-05-09 | 0 | 45.42 | 0 | 111.16 | 0 | 57.91 | 0 | 251.04 | 0 | 1889.53 |
| 2026-05-08 | 0 | 45.42 | 0 | 111.16 | 0 | 57.91 | 0 | 251.04 | 0 | 1889.53 |
| 2026-05-07 | 0 | 45.42 | 0 | 111.16 | 0 | 57.91 | 0 | 251.04 | 2.72 | 1889.53 |
| 2026-05-06 | 0 | 45.42 | 0 | 111.16 | 0 | 57.91 | 0 | 251.04 | 0 | 1886.81 |
| 2026-05-05 | 0 | 45.42 | 0 | 111.16 | 0 | 57.91 | 0 | 251.04 | 0 | 1886.81 |
| 2026-05-04 | 0 | 45.42 | 0 | 111.16 | 0 | 57.91 | 0 | 251.04 | 0 | 1886.81 |
| 2026-05-03 | 0 | 45.42 | 0 | 111.16 | 0 | 57.91 | 0 | 251.04 | 0 | 1886.81 |
| 2026-05-02 | 0 | 45.42 | 0 | 111.16 | 0 | 57.91 | 0 | 251.04 | 0 | 1886.81 |
| 2026-05-01 | 0 | 45.42 | 0 | 111.16 | 0 | 57.91 | 0 | 251.04 | 17.32 | 1886.81 |
| 2026-04-30 | 0 | 45.42 | 0 | 111.16 | 0 | 57.91 | 2.72 | 251.04 | 20.04 | 1869.49 |
| 2026-04-29 | 0 | 45.42 | 0 | 111.16 | 0 | 57.91 | 0 | 248.32 | 12.99 | 1849.45 |
| 2026-04-28 | 0 | 45.42 | 0 | 111.16 | 0 | 57.91 | 0 | 248.32 | 0 | 1836.46 |
| 2026-04-27 | 0 | 45.42 | 0 | 111.16 | 0 | 57.91 | 0 | 248.32 | 5.44 | 1836.46 |
| 2026-04-26 | 0 | 45.42 | 0 | 111.16 | 0 | 57.91 | 0 | 248.32 | 0 | 1831.02 |
| 2026-04-25 | 0 | 45.42 | 0 | 111.16 | 0 | 57.91 | 0 | 248.32 | 0 | 1831.02 |
| 2026-04-24 | 0 | 45.42 | 0 | 111.16 | 0 | 57.91 | 0 | 248.32 | 0 | 1831.02 |
| 2026-04-23 | 0 | 45.42 | 0 | 111.16 | 0 | 57.91 | 0 | 248.32 | 0 | 1831.02 |
| 2026-04-22 | 0 | 45.42 | 0 | 111.16 | 0 | 57.91 | 0 | 248.32 | 8.66 | 1831.02 |
| 2026-04-21 | 0 | 45.42 | 0 | 111.16 | 0 | 57.91 | 0 | 248.32 | 0 | 1822.36 |
| 2026-04-20 | 0 | 45.42 | 0 | 111.16 | 0 | 57.91 | 0 | 248.32 | 0 | 1822.36 |
| 2026-04-19 | 0 | 45.42 | 0 | 111.16 | 0 | 57.91 | 0 | 248.32 | 2.72 | 1822.36 |
| 2026-04-18 | 0 | 45.42 | 0 | 111.16 | 0 | 57.91 | 0 | 248.32 | 0 | 1819.64 |
| 2026-04-17 | 0 | 45.42 | 0 | 111.16 | 0 | 57.91 | 0 | 248.32 | 0 | 1819.64 |
| 2026-04-16 | 0 | 45.42 | 0 | 111.16 | 0 | 57.91 | 0 | 248.32 | 0 | 1819.64 |
| 2026-04-15 | 0 | 45.42 | 0 | 111.16 | 0 | 57.91 | 0 | 248.32 | 0 | 1819.64 |
| 2026-04-14 | 0 | 45.42 | 0 | 111.16 | 0 | 57.91 | 0 | 248.32 | 8.66 | 1819.64 |
| 2026-04-13 | 0 | 45.42 | 0 | 111.16 | 0 | 57.91 | 0 | 248.32 | 2.72 | 1810.98 |
| 2026-04-12 | 0 | 45.42 | 0 | 111.16 | 0 | 57.91 | 2.72 | 248.32 | 0 | 1808.26 |
| 2026-04-11 | 0 | 45.42 | 0 | 111.16 | 0 | 57.91 | 0 | 245.6 | 5.44 | 1808.26 |
| 2026-04-10 | 0 | 45.42 | 0 | 111.16 | 0 | 57.91 | 0 | 245.6 | 0 | 1802.82 |
| 2026-04-09 | 0 | 45.42 | 0 | 111.16 | 0 | 57.91 | 0 | 245.6 | 2.72 | 1802.82 |
| 2026-04-08 | 0 | 45.42 | 0 | 111.16 | 0 | 57.91 | 2.72 | 245.6 | 2.72 | 1800.1 |
| 2026-04-07 | 0 | 45.42 | 0 | 111.16 | 0 | 57.91 | 0 | 242.88 | 4.76 | 1797.38 |
| 2026-04-06 | 0 | 45.42 | 0 | 111.16 | 0 | 57.91 | 0 | 242.88 | 22.76 | 1792.62 |
| 2026-04-05 | 0 | 45.42 | 0 | 111.16 | 0 | 57.91 | 0 | 242.88 | 5.44 | 1769.86 |
| 2026-04-04 | 0 | 45.42 | 0 | 111.16 | 0 | 57.91 | 2.72 | 242.88 | 7.05 | 1764.42 |
| 2026-04-03 | 0 | 45.42 | 0 | 111.16 | 0 | 57.91 | 0 | 240.16 | 2.72 | 1757.37 |
| 2026-04-02 | 0 | 45.42 | 0 | 111.16 | 0 | 57.91 | 2.72 | 240.16 | 44.41 | 1754.65 |
| 2026-04-01 | 0 | 45.42 | 0 | 111.16 | 0 | 57.91 | 0 | 237.44 | 30.31 | 1710.24 |
| 2026-03-31 | 0 | 45.42 | 0 | 111.16 | 0 | 57.91 | 0 | 237.44 | 25.48 | 1679.93 |
| 2026-03-30 | 0 | 45.42 | 0 | 111.16 | 0 | 57.91 | 2.72 | 237.44 | 20.04 | 1654.45 |
| 2026-03-29 | 0 | 45.42 | 0 | 111.16 | 0 | 57.91 | 0 | 234.72 | 22.76 | 1634.41 |
| 2026-03-28 | 0 | 45.42 | 0 | 111.16 | 0 | 57.91 | 0 | 234.72 | 20.04 | 1611.65 |
| 2026-03-27 | 0 | 45.42 | 0 | 111.16 | 0 | 57.91 | 0 | 234.72 | 0 | 1591.61 |
| 2026-03-26 | 0 | 45.42 | 4.33 | 111.16 | 0 | 57.91 | 4.33 | 234.72 | 73.61 | 1591.61 |
| 2026-03-25 | 0 | 45.42 | 0 | 106.83 | 0 | 57.91 | 17.32 | 230.39 | 34.64 | 1518 |
| 2026-03-24 | 0 | 45.42 | 0 | 106.83 | 0 | 57.91 | 0 | 213.07 | 9.34 | 1483.36 |
| 2026-03-23 | 0 | 45.42 | 0 | 106.83 | 0 | 57.91 | 2.72 | 213.07 | 8.66 | 1474.02 |
| 2026-03-22 | 0 | 45.42 | 0 | 106.83 | 0 | 57.91 | 0 | 210.35 | 2.72 | 1465.36 |
| 2026-03-21 | 0 | 45.42 | 0 | 106.83 | 0 | 57.91 | 0 | 210.35 | 11.38 | 1462.64 |
| 2026-03-20 | 2.6 | 45.42 | 5.2 | 106.83 | 0 | 57.91 | 0 | 210.35 | 5.44 | 1451.26 |
| 2026-03-19 | 0 | 42.82 | 0 | 101.63 | 0 | 57.91 | 0 | 210.35 | 0 | 1445.82 |
| 2026-03-18 | 0 | 42.82 | 0 | 101.63 | 0 | 57.91 | 0 | 210.35 | 17.32 | 1445.82 |
| 2026-03-17 | 0 | 42.82 | 0 | 101.63 | 0 | 57.91 | 0 | 210.35 | 17.32 | 1428.5 |
| 2026-03-16 | 0 | 42.82 | 0 | 101.63 | 0 | 57.91 | 0 | 210.35 | 15.71 | 1411.18 |
| 2026-03-15 | 0 | 42.82 | 8.73 | 101.63 | 0 | 57.91 | 0 | 210.35 | 28.7 | 1395.47 |
| 2026-03-14 | 0 | 42.82 | 0 | 92.9 | 0 | 57.91 | 0 | 210.35 | 46.02 | 1366.77 |
| 2026-03-13 | 0 | 42.82 | 0 | 92.9 | 0 | 57.91 | 2.72 | 210.35 | 5.44 | 1320.75 |
| 2026-03-12 | 4.33 | 42.82 | 0 | 92.9 | 30.12 | 57.91 | 4.33 | 207.63 | 72 | 1315.31 |
| 2026-03-11 | 0 | 38.49 | 0 | 92.9 | 10.13 | 27.79 | 0 | 203.3 | 51.96 | 1243.31 |
| 2026-03-10 | 2.6 | 38.49 | 2.6 | 92.9 | 7.81 | 17.66 | 4.33 | 203.3 | 61.73 | 1191.35 |
| 2026-03-09 | 4.65 | 35.89 | 2.6 | 90.3 | 0 | 9.85 | 17.32 | 198.97 | 42.8 | 1129.62 |
| 2026-03-08 | 0 | 31.24 | 2.6 | 87.7 | 7.25 | 9.85 | 0 | 181.65 | 42.8 | 1086.82 |
| 2026-03-07 | 0 | 31.24 | 0 | 85.1 | 2.6 | 2.6 | 0 | 181.65 | 45.52 | 1044.02 |
| 2026-03-06 | 0 | 31.24 | 0 | 85.1 | 0 | 0 | 0 | 181.65 | 12.74 | 998.5 |
| 2026-03-05 | 0 | 31.24 | 2.33 | 85.1 | 0 | 0 | 0 | 181.65 | 82.27 | 985.76 |
| 2026-03-04 | 0 | 31.24 | 0 | 82.77 | 0 | 0 | 0 | 181.65 | 22.76 | 903.49 |
| 2026-03-03 | 0 | 31.24 | 0 | 82.77 | 0 | 0 | 0 | 181.65 | 50.35 | 880.73 |
| 2026-03-02 | 19.92 | 31.24 | 19.92 | 82.77 | 0 | 0 | 0 | 181.65 | 0 | 830.38 |
| 2026-03-01 | 0 | 11.32 | 0 | 62.85 | 0 | 0 | 0 | 181.65 | 2.72 | 830.38 |
| 2026-02-28 | 0 | 11.32 | 2.6 | 62.85 | 0 | 0 | 0 | 181.65 | 0 | 827.66 |
| 2026-02-27 | 0 | 11.32 | 2.33 | 60.25 | 0 | 0 | 17.32 | 181.65 | 0 | 827.66 |
| 2026-02-26 | 0 | 11.32 | 2.33 | 57.92 | 0 | 0 | 0 | 164.33 | 0 | 827.66 |
| 2026-02-25 | 0 | 11.32 | 0 | 55.59 | 0 | 0 | 31.42 | 164.33 | 2.72 | 827.66 |
| 2026-02-24 | 2.6 | 11.32 | 2.6 | 55.59 | 0 | 0 | 0.68 | 132.91 | 29.38 | 824.94 |
| 2026-02-23 | 0 | 8.72 | 2.6 | 52.99 | 0 | 0 | 0 | 132.23 | 8.16 | 795.56 |
| 2026-02-22 | 2.6 | 8.72 | 2.6 | 50.39 | 0 | 0 | 2.72 | 132.23 | 13.6 | 787.4 |
| 2026-02-21 | 2.6 | 6.12 | 2.6 | 47.79 | 0 | 0 | 0 | 129.51 | 19.54 | 773.8 |
| 2026-02-20 | 0 | 3.52 | 2.6 | 45.19 | 0 | 0 | 22.76 | 129.51 | 62.84 | 754.26 |
| 2026-02-19 | 0 | 3.52 | 4.33 | 42.59 | 0 | 0 | 17.32 | 106.75 | 90.43 | 691.42 |
| 2026-02-18 | 0 | 3.52 | 0 | 38.26 | 0 | 0 | 2.72 | 89.43 | 17.32 | 600.99 |
| 2026-02-17 | 0 | 3.52 | 0 | 38.26 | 0 | 0 | 0 | 86.71 | 12.99 | 583.67 |
| 2026-02-16 | 0 | 3.52 | 0 | 38.26 | 0 | 0 | 0 | 86.71 | 2.72 | 570.68 |
| 2026-02-15 | 0 | 3.52 | 0 | 38.26 | 0 | 0 | 0 | 86.71 | 0 | 567.96 |
| 2026-02-14 | 0 | 3.52 | 0 | 38.26 | 0 | 0 | 0 | 86.71 | 0 | 567.96 |
| 2026-02-13 | 0 | 3.52 | 0 | 38.26 | 0 | 0 | 0 | 86.71 | 15.71 | 567.96 |
| 2026-02-12 | 0 | 3.52 | 0 | 38.26 | 0 | 0 | 0 | 86.71 | 21.65 | 552.25 |
| 2026-02-11 | 0 | 3.52 | 0 | 38.26 | 0 | 0 | 0 | 86.71 | 8.66 | 530.6 |
| 2026-02-10 | 0 | 3.52 | 0 | 38.26 | 0 | 0 | 0 | 86.71 | 21.65 | 521.94 |
| 2026-02-09 | 0 | 3.52 | 0 | 38.26 | 0 | 0 | 0 | 86.71 | 17.32 | 500.29 |
| 2026-02-08 | 0 | 3.52 | 0 | 38.26 | 0 | 0 | 2.72 | 86.71 | 0 | 482.97 |
| 2026-02-07 | 3.52 | 3.52 | 3.52 | 38.26 | 0 | 0 | 0 | 83.99 | 0 | 482.97 |
| 2026-02-06 | 0 | 0 | 0 | 34.74 | 0 | 0 | 0 | 83.99 | 0 | 482.97 |
| 2026-02-05 | 0 | 0 | 0 | 34.74 | 0 | 0 | 0 | 83.99 | 21.65 | 482.97 |
| 2026-02-04 | 0 | 0 | 0 | 34.74 | 0 | 0 | 0 | 83.99 | 0 | 461.32 |
| 2026-02-03 | 0 | 0 | 0 | 34.74 | 0 | 0 | 0 | 83.99 | 0 | 461.32 |
| 2026-02-02 | 0 | 0 | 0 | 34.74 | 0 | 0 | 0 | 83.99 | 0 | 461.32 |
| 2026-02-01 | 0 | 0 | 4.33 | 34.74 | 0 | 0 | 0 | 83.99 | 8.66 | 461.32 |
| 2026-01-31 | 0 | 0 | 20.32 | 30.41 | 0 | 0 | 0 | 83.99 | 57.4 | 452.66 |
| 2026-01-30 | 0 | 0 | 0 | 10.09 | 0 | 0 | 17.32 | 83.99 | 28.2 | 395.26 |
| 2026-01-29 | 0 | 0 | 0 | 10.09 | 0 | 0 | 20.04 | 66.67 | 64.45 | 367.06 |
| 2026-01-28 | 0 | 0 | 2.88 | 10.09 | 0 | 0 | 0 | 46.63 | 22.76 | 302.61 |
| 2026-01-27 | 0 | 0 | 4.33 | 7.21 | 0 | 0 | 0 | 46.63 | 21.15 | 279.85 |
| 2026-01-26 | 0 | 0 | 0 | 2.88 | 0 | 0 | 0 | 46.63 | 45.52 | 258.7 |
| 2026-01-25 | 0 | 0 | 0 | 2.88 | 0 | 0 | 0 | 46.63 | 22.76 | 213.18 |
| 2026-01-24 | 0 | 0 | 0 | 2.88 | 0 | 0 | 0 | 46.63 | 37.36 | 190.42 |
| 2026-01-23 | 0 | 0 | 0 | 2.88 | 0 | 0 | 0 | 46.63 | 0 | 153.06 |
| 2026-01-22 | 0 | 0 | 0 | 2.88 | 0 | 0 | 2.72 | 46.63 | 0.68 | 153.06 |
| 2026-01-21 | 0 | 0 | 0 | 2.88 | 0 | 0 | 0 | 43.91 | 0 | 152.38 |
| 2026-01-20 | 0 | 0 | 0 | 2.88 | 0 | 0 | 0 | 43.91 | 4.33 | 152.38 |
| 2026-01-19 | 0 | 0 | 0 | 2.88 | 0 | 0 | 0 | 43.91 | 0 | 148.05 |
| 2026-01-18 | 0 | 0 | 0 | 2.88 | 0 | 0 | 0 | 43.91 | 0 | 148.05 |
| 2026-01-17 | 0 | 0 | 0 | 2.88 | 0 | 0 | 0 | 43.91 | 0 | 148.05 |
| 2026-01-16 | 0 | 0 | 0 | 2.88 | 0 | 0 | 0 | 43.91 | 0 | 148.05 |
| 2026-01-15 | 0 | 0 | 0 | 2.88 | 0 | 0 | 0 | 43.91 | 0 | 148.05 |
| 2026-01-14 | 0 | 0 | 0 | 2.88 | 0 | 0 | 0 | 43.91 | 4.33 | 148.05 |
| 2026-01-13 | 0 | 0 | 0 | 2.88 | 0 | 0 | 0 | 43.91 | 21.65 | 143.72 |
| 2026-01-12 | 0 | 0 | 0 | 2.88 | 0 | 0 | 0 | 43.91 | 0 | 122.07 |
| 2026-01-11 | 0 | 0 | 0 | 2.88 | 0 | 0 | 0 | 43.91 | 20.04 | 122.07 |
| 2026-01-10 | 0 | 0 | 0 | 2.88 | 0 | 0 | 17.32 | 43.91 | 0 | 102.03 |
| 2026-01-09 | 0 | 0 | 0 | 2.88 | 0 | 0 | 8.66 | 26.59 | 5.44 | 102.03 |
| 2026-01-08 | 0 | 0 | 0 | 2.88 | 0 | 0 | 7.05 | 17.93 | 26.59 | 96.59 |
| 2026-01-07 | 0 | 0 | 0 | 2.88 | 0 | 0 | 5.44 | 10.88 | 40.08 | 70 |
| 2026-01-06 | 0 | 0 | 0 | 2.88 | 0 | 0 | 0 | 5.44 | 5.44 | 29.92 |
| 2026-01-05 | 0 | 0 | 0 | 2.88 | 0 | 0 | 0 | 5.44 | 2.72 | 24.48 |
| 2026-01-04 | 0 | 0 | 0 | 2.88 | 0 | 0 | 0 | 5.44 | 2.72 | 21.76 |
| 2026-01-03 | 0 | 0 | 0 | 2.88 | 0 | 0 | 2.72 | 5.44 | 2.72 | 19.04 |
| 2026-01-02 | 0 | 0 | 0 | 2.88 | 0 | 0 | 0 | 2.72 | 8.16 | 16.32 |
| 2026-01-01 | 0 | 0 | 0 | 2.88 | 0 | 0 | 0 | 2.72 | 2.72 | 8.16 |
| 2025-12-31 | 0 | 0 | 0 | 2.88 | 0 | 0 | 0 | 2.72 | 0 | 5.44 |
| 2025-12-30 | 0 | 0 | 0 | 2.88 | 0 | 0 | 0 | 2.72 | 2.72 | 5.44 |
| 2025-12-29 | 0 | 0 | 0 | 2.88 | 0 | 0 | 0 | 2.72 | 2.72 | 2.72 |
| 2025-12-28 | 0 | 0 | 0 | 2.88 | 0 | 0 | 0 | 2.72 | 0 | 0 |
| 2025-12-27 | 0 | 0 | 0 | 2.88 | 0 | 0 | 2.72 | 2.72 | 0 | 0 |
| 2025-12-26 | 0 | 0 | 2.88 | 2.88 | 0 | 0 | 0 | 0 | 0 | 0 |
| 2025-12-25 | 0 | 0 | 0 | 0 | 0 | 0 | 0 | 0 | 0 | 0 |
| 2025-12-24 | 0 | 0 | 0 | 0 | 0 | 0 | 0 | 0 | 0 | 0 |
| 2025-12-23 | 0 | 0 | 0 | 0 | 0 | 0 | 0 | 0 | 0 | 0 |
| 2025-12-22 | 0 | 0 | 0 | 0 | 0 | 0 | 0 | 0 | 0 | 0 |
| 2025-12-21 | 0 | 0 | 0 | 0 | 0 | 0 | 0 | 0 | 0 | 0 |
| 2025-12-20 | 0 | 0 | 0 | 0 | 0 | 0 | 0 | 0 | 0 | 0 |
| 2025-12-19 | 0 | 0 | 0 | 0 | 0 | 0 | 0 | 0 | 0 | 0 |
| 2025-12-18 | 0 | 0 | 0 | 0 | 0 | 0 | 0 | 0 | 0 | 0 |
| 2025-12-17 | 0 | 0 | 0 | 0 | 0 | 0 | 0 | 0 | 0 | 0 |
| 2025-12-16 | 0 | 0 | 0 | 0 | 0 | 0 | 0 | 0 | 0 | 0 |
| 2025-12-15 | 0 | 0 | 0 | 0 | 0 | 0 | 0 | 0 | 0 | 0 |
| 2025-12-14 | 0 | 0 | 0 | 0 | 0 | 0 | 0 | 0 | 0 | 0 |
| 2025-12-13 | 0 | 0 | 0 | 0 | 0 | 0 | 0 | 0 | 0 | 0 |
| 2025-12-12 | 0 | 0 | 0 | 0 | 0 | 0 | 0 | 0 | 0 | 0 |
| 2025-12-11 | 0 | 0 | 0 | 0 | 0 | 0 | 0 | 0 | 0 | 0 |
| 2025-12-10 | 0 | 0 | 0 | 0 | 0 | 0 | 0 | 0 | 0 | 0 |
| 2025-12-09 | 0 | 0 | 0 | 0 | 0 | 0 | 0 | 0 | 0 | 0 |
| 2025-12-08 | 0 | 0 | 0 | 0 | 0 | 0 | 0 | 0 | 0 | 0 |
| 2025-12-07 | 0 | 0 | 0 | 0 | 0 | 0 | 0 | 0 | 0 | 0 |
| 2025-12-06 | 0 | 0 | 0 | 0 | 0 | 0 | 0 | 0 | 0 | 0 |
| 2025-12-05 | 0 | 0 | 0 | 0 | 0 | 0 | 0 | 0 | 0 | 0 |
| 2025-12-04 | 0 | 0 | 0 | 0 | 0 | 0 | 0 | 0 | 0 | 0 |
| 2025-12-03 | 0 | 0 | 0 | 0 | 0 | 0 | 0 | 0 | 0 | 0 |
| 2025-12-02 | 0 | 0 | 0 | 0 | 0 | 0 | 0 | 0 | 0 | 0 |
| 2025-12-01 | 0 | 0 | 0 | 0 | 0 | 0 | 0 | 0 | 0 | 0 |
| 2025-11-30 | 0 | 0 | 0 | 0 | 0 | 0 | 0 | 0 | 0 | 0 |
| 2025-11-29 | 0 | 0 | 0 | 0 | 0 | 0 | 0 | 0 | 0 | 0 |
| 2025-11-28 | 0 | 0 | 0 | 0 | 0 | 0 | 0 | 0 | 0 | 0 |
| 2025-11-27 | 0 | 0 | 0 | 0 | 0 | 0 | 0 | 0 | 0 | 0 |
| 2025-11-26 | 0 | 0 | 0 | 0 | 0 | 0 | 0 | 0 | 0 | 0 |
| 2025-11-25 | 0 | 0 | 0 | 0 | 0 | 0 | 0 | 0 | 0 | 0 |
| 2025-11-24 | 0 | 0 | 0 | 0 | 0 | 0 | 0 | 0 | 0 | 0 |
| 2025-11-23 | 0 | 0 | 0 | 0 | 0 | 0 | 0 | 0 | 0 | 0 |
| 2025-11-22 | 0 | 0 | 0 | 0 | 0 | 0 | 0 | 0 | 0 | 0 |
| 2025-11-21 | 0 | 0 | 0 | 0 | 0 | 0 | 0 | 0 | 0 | 0 |
| 2025-11-20 | 0 | 0 | 0 | 0 | 0 | 0 | 0 | 0 | 0 | 0 |
| 2025-11-19 | 0 | 0 | 0 | 0 | 0 | 0 | 0 | 0 | 0 | 0 |
| 2025-11-18 | 0 | 0 | 0 | 0 | 0 | 0 | 0 | 0 | 0 | 0 |
| 2025-11-17 | 0 | 0 | 0 | 0 | 0 | 0 | 0 | 0 | 0 | 0 |
| 2025-11-16 | 0 | 0 | 0 | 0 | 0 | 0 | 0 | 0 | 0 | 0 |
| 2025-11-15 | 0 | 0 | 0 | 0 | 0 | 0 | 0 | 0 | 0 | 0 |
| 2025-11-14 | 0 | 0 | 0 | 0 | 0 | 0 | 0 | 0 | 0 | 0 |
| 2025-11-13 | 0 | 0 | 0 | 0 | 0 | 0 | 0 | 0 | 0 | 0 |
| 2025-11-12 | 0 | 0 | 0 | 0 | 0 | 0 | 0 | 0 | 0 | 0 |
| 2025-11-11 | 0 | 0 | 0 | 0 | 0 | 0 | 0 | 0 | 0 | 0 |
| 2025-11-10 | 0 | 0 | 0 | 0 | 0 | 0 | 0 | 0 | 0 | 0 |
| 2025-11-09 | 0 | 0 | 0 | 0 | 0 | 0 | 0 | 0 | 0 | 0 |
| 2025-11-08 | 0 | 0 | 0 | 0 | 0 | 0 | 0 | 0 | 0 | 0 |
| 2025-11-07 | 0 | 0 | 0 | 0 | 0 | 0 | 0 | 0 | 0 | 0 |
| 2025-11-06 | 0 | 0 | 0 | 0 | 0 | 0 | 0 | 0 | 0 | 0 |
| 2025-11-05 | 0 | 0 | 0 | 0 | 0 | 0 | 0 | 0 | 0 | 0 |
| 2025-11-04 | 0 | 0 | 0 | 0 | 0 | 0 | 0 | 0 | 0 | 0 |
| 2025-11-03 | 0 | 0 | 0 | 0 | 0 | 0 | 0 | 0 | 0 | 0 |
| 2025-11-02 | 0 | 0 | 0 | 0 | 0 | 0 | 0 | 0 | 0 | 0 |
| 2025-11-01 | 0 | 0 | 0 | 0 | 0 | 0 | 0 | 0 | 0 | 0 |
| 2025-10-31 | 0 | 0 | 0 | 0 | 0 | 0 | 0 | 0 | 0 | 0 |
| 2025-10-30 | 0 | 0 | 0 | 0 | 0 | 0 | 0 | 0 | 0 | 0 |
| 2025-10-29 | 0 | 0 | 0 | 0 | 0 | 0 | 0 | 0 | 0 | 0 |
| 2025-10-28 | 0 | 0 | 0 | 0 | 0 | 0 | 0 | 0 | 0 | 0 |
| 2025-10-27 | 0 | 0 | 0 | 0 | 0 | 0 | 0 | 0 | 0 | 0 |
| 2025-10-26 | 0 | 0 | 0 | 0 | 0 | 0 | 0 | 0 | 0 | 0 |
| 2025-10-25 | 0 | 0 | 0 | 0 | 0 | 0 | 0 | 0 | 0 | 0 |
| 2025-10-24 | 0 | 0 | 0 | 0 | 0 | 0 | 0 | 0 | 0 | 0 |
| 2025-10-23 | 0 | 0 | 0 | 0 | 0 | 0 | 0 | 0 | 0 | 0 |
| 2025-10-22 | 0 | 0 | 0 | 0 | 0 | 0 | 0 | 0 | 0 | 0 |
| 2025-10-21 | 0 | 0 | 0 | 0 | 0 | 0 | 0 | 0 | 0 | 0 |
| 2025-10-20 | 0 | 0 | 0 | 0 | 0 | 0 | 0 | 0 | 0 | 0 |
| 2025-10-19 | 0 | 0 | 0 | 0 | 0 | 0 | 0 | 0 | 0 | 0 |
| 2025-10-18 | 0 | 0 | 0 | 0 | 0 | 0 | 0 | 0 | 0 | 0 |
| 2025-10-17 | 0 | 0 | 0 | 0 | 0 | 0 | 0 | 0 | 0 | 0 |
| 2025-10-16 | 0 | 0 | 0 | 0 | 0 | 0 | 0 | 0 | 0 | 0 |
| 2025-10-15 | 0 | 0 | 0 | 0 | 0 | 0 | 0 | 0 | 0 | 0 |
| 2025-10-14 | 0 | 0 | 0 | 0 | 0 | 0 | 0 | 0 | 0 | 0 |
| 2025-10-13 | 0 | 0 | 0 | 0 | 0 | 0 | 0 | 0 | 0 | 0 |
| 2025-10-12 | 0 | 0 | 0 | 0 | 0 | 0 | 0 | 0 | 0 | 0 |
| 2025-10-11 | 0 | 0 | 0 | 0 | 0 | 0 | 0 | 0 | 0 | 0 |
| 2025-10-10 | 0 | 0 | 0 | 0 | 0 | 0 | 0 | 0 | 0 | 0 |
| 2025-10-09 | 0 | 0 | 0 | 0 | 0 | 0 | 0 | 0 | 0 | 0 |
| 2025-10-08 | 0 | 0 | 0 | 0 | 0 | 0 | 0 | 0 | 0 | 0 |
| 2025-10-07 | 0 | 0 | 0 | 0 | 0 | 0 | 0 | 0 | 0 | 0 |
| 2025-10-06 | 0 | 0 | 0 | 0 | 0 | 0 | 0 | 0 | 0 | 0 |
| 2025-10-05 | 0 | 0 | 0 | 0 | 0 | 0 | 0 | 0 | 0 | 0 |
| 2025-10-04 | 0 | 0 | 0 | 0 | 0 | 0 | 0 | 0 | 0 | 0 |
| 2025-10-03 | 0 | 0 | 0 | 0 | 0 | 0 | 0 | 0 | 0 | 0 |
| 2025-10-02 | 0 | 0 | 0 | 0 | 0 | 0 | 0 | 0 | 0 | 0 |
| 2025-10-01 | 0 | 0 | 0 | 0 | 0 | 0 | 0 | 0 | 0 | 0 |
| 2025-09-30 | 0 | 0 | 0 | 0 | 0 | 0 | 0 | 0 | 0 | 0 |
| 2025-09-29 | 0 | 0 | 0 | 0 | 0 | 0 | 0 | 0 | 0 | 0 |
| 2025-09-28 | 0 | 0 | 0 | 0 | 0 | 0 | 0 | 0 | 0 | 0 |
| 2025-09-27 | 0 | 0 | 0 | 0 | 0 | 0 | 0 | 0 | 0 | 0 |
| 2025-09-26 | 0 | 0 | 0 | 0 | 0 | 0 | 0 | 0 | 0 | 0 |
| 2025-09-25 | 0 | 0 | 0 | 0 | 0 | 0 | 0 | 0 | 0 | 0 |
| 2025-09-24 | 0 | 0 | 0 | 0 | 0 | 0 | 0 | 0 | 0 | 0 |
| 2025-09-23 | 0 | 0 | 0 | 0 | 0 | 0 | 0 | 0 | 0 | 0 |
| 2025-09-22 | 0 | 0 | 0 | 0 | 0 | 0 | 0 | 0 | 0 | 0 |
| 2025-09-21 | 0 | 0 | 0 | 0 | 0 | 0 | 0 | 0 | 0 | 0 |
| 2025-09-20 | 0 | 0 | 0 | 0 | 0 | 0 | 0 | 0 | 0 | 0 |
| 2025-09-19 | 0 | 0 | 0 | 0 | 0 | 0 | 0 | 0 | 0 | 0 |
| 2025-09-18 | 0 | 0 | 0 | 0 | 0 | 0 | 0 | 0 | 0 | 0 |
| 2025-09-17 | 0 | 0 | 0 | 0 | 0 | 0 | 0 | 0 | 0 | 0 |
| 2025-09-16 | 0 | 0 | 0 | 0 | 0 | 0 | 0 | 0 | 0 | 0 |
| 2025-09-15 | 0 | 0 | 0 | 0 | 0 | 0 | 0 | 0 | 0 | 0 |
| 2025-09-14 | 0 | 0 | 0 | 0 | 0 | 0 | 0 | 0 | 0 | 0 |
| 2025-09-13 | 0 | 0 | 0 | 0 | 0 | 0 | 0 | 0 | 0 | 0 |
| 2025-09-12 | 0 | 0 | 0 | 0 | 0 | 0 | 0 | 0 | 0 | 0 |
| 2025-09-11 | 0 | 0 | 0 | 0 | 0 | 0 | 0 | 0 | 0 | 0 |
| 2025-09-10 | 0 | 0 | 0 | 0 | 0 | 0 | 0 | 0 | 0 | 0 |
| 2025-09-09 | 0 | 0 | 0 | 0 | 0 | 0 | 0 | 0 | 0 | 0 |
| 2025-09-08 | 0 | 0 | 0 | 0 | 0 | 0 | 0 | 0 | 0 | 0 |
| 2025-09-07 | 0 | 0 | 0 | 0 | 0 | 0 | 0 | 0 | 0 | 0 |
| 2025-09-06 | 0 | 0 | 0 | 0 | 0 | 0 | 0 | 0 | 0 | 0 |
| 2025-09-05 | 0 | 0 | 0 | 0 | 0 | 0 | 0 | 0 | 0 | 0 |
| 2025-09-04 | 0 | 0 | 0 | 0 | 0 | 0 | 0 | 0 | 0 | 0 |
| 2025-09-03 | 0 | 0 | 0 | 0 | 0 | 0 | 0 | 0 | 0 | 0 |
| 2025-09-02 | 0 | 0 | 0 | 0 | 0 | 0 | 0 | 0 | 0 | 0 |
| 2025-09-01 | 0 | 0 | 0 | 0 | 0 | 0 | 0 | 0 | 0 | 0 |
| 2025-08-31 | 0 | 0 | 0 | 0 | 0 | 0 | 0 | 0 | 0 | 0 |
| 2025-08-30 | 0 | 0 | 0 | 0 | 0 | 0 | 0 | 0 | 0 | 0 |
| 2025-08-29 | 0 | 0 | 0 | 0 | 0 | 0 | 0 | 0 | 0 | 0 |
| 2025-08-28 | 0 | 0 | 0 | 0 | 0 | 0 | 0 | 0 | 0 | 0 |
| 2025-08-27 | 0 | 0 | 0 | 0 | 0 | 0 | 0 | 0 | 0 | 0 |
| 2025-08-26 | 0 | 0 | 0 | 0 | 0 | 0 | 0 | 0 | 0 | 0 |
| 2025-08-25 | 0 | 0 | 0 | 0 | 0 | 0 | 0 | 0 | 0 | 0 |
| 2025-08-24 | 0 | 0 | 0 | 0 | 0 | 0 | 0 | 0 | 0 | 0 |
| 2025-08-23 | 0 | 0 | 0 | 0 | 0 | 0 | 0 | 0 | 0 | 0 |
| 2025-08-22 | 0 | 0 | 0 | 0 | 0 | 0 | 0 | 0 | 0 | 0 |
| 2025-08-21 | 0 | 0 | 0 | 0 | 0 | 0 | 0 | 0 | 0 | 0 |
| 2025-08-20 | 0 | 0 | 0 | 0 | 0 | 0 | 0 | 0 | 0 | 0 |
| 2025-08-19 | 0 | 0 | 0 | 0 | 0 | 0 | 0 | 0 | 0 | 0 |
| 2025-08-18 | 0 | 0 | 0 | 0 | 0 | 0 | 0 | 0 | 0 | 0 |
| 2025-08-17 | 0 | 0 | 0 | 0 | 0 | 0 | 0 | 0 | 0 | 0 |
| 2025-08-16 | 0 | 0 | 0 | 0 | 0 | 0 | 0 | 0 | 0 | 0 |
| 2025-08-15 | 0 | 0 | 0 | 0 | 0 | 0 | 0 | 0 | 0 | 0 |
| 2025-08-14 | 0 | 0 | 0 | 0 | 0 | 0 | 0 | 0 | 0 | 0 |
| 2025-08-13 | 0 | 0 | 0 | 0 | 0 | 0 | 0 | 0 | 0 | 0 |
| 2025-08-12 | 0 | 0 | 0 | 0 | 0 | 0 | 0 | 0 | 0 | 0 |
| 2025-08-11 | 0 | 0 | 0 | 0 | 0 | 0 | 0 | 0 | 0 | 0 |
| 2025-08-10 | 0 | 0 | 0 | 0 | 0 | 0 | 0 | 0 | 0 | 0 |
| 2025-08-09 | 0 | 0 | 0 | 0 | 0 | 0 | 0 | 0 | 0 | 0 |
| 2025-08-08 | 0 | 0 | 0 | 0 | 0 | 0 | 0 | 0 | 0 | 0 |
| 2025-08-07 | 0 | 0 | 0 | 0 | 0 | 0 | 0 | 0 | 0 | 0 |
| 2025-08-06 | 0 | 0 | 0 | 0 | 0 | 0 | 0 | 0 | 0 | 0 |
| 2025-08-05 | 0 | 0 | 0 | 0 | 0 | 0 | 0 | 0 | 0 | 0 |
| 2025-08-04 | 0 | 0 | 0 | 0 | 0 | 0 | 0 | 0 | 0 | 0 |
| 2025-08-03 | 0 | 0 | 0 | 0 | 0 | 0 | 0 | 0 | 0 | 0 |
| 2025-08-02 | 0 | 0 | 0 | 0 | 0 | 0 | 0 | 0 | 0 | 0 |
| 2025-08-01 | 0 | 0 | 0 | 0 | 0 | 0 | 0 | 0 | 0 | 0 |
| 2025-07-31 | 0 | 0 | 0 | 0 | 0 | 0 | 0 | 0 | 0 | 0 |
| 2025-07-30 | 0 | 0 | 0 | 0 | 0 | 0 | 0 | 0 | 0 | 0 |
| 2025-07-29 | 0 | 0 | 0 | 0 | 0 | 0 | 0 | 0 | 0 | 0 |
| 2025-07-28 | 0 | 0 | 0 | 0 | 0 | 0 | 0 | 0 | 0 | 0 |
| 2025-07-27 | 0 | 0 | 0 | 0 | 0 | 0 | 0 | 0 | 0 | 0 |
| 2025-07-26 | 0 | 0 | 0 | 0 | 0 | 0 | 0 | 0 | 0 | 0 |
| 2025-07-25 | 0 | 0 | 0 | 0 | 0 | 0 | 0 | 0 | 0 | 0 |
| 2025-07-24 | 0 | 0 | 0 | 0 | 0 | 0 | 0 | 0 | 0 | 0 |
| 2025-07-23 | 0 | 0 | 0 | 0 | 0 | 0 | 0 | 0 | 0 | 0 |
| 2025-07-22 | 0 | 0 | 0 | 0 | 0 | 0 | 0 | 0 | 0 | 0 |
| 2025-07-21 | 0 | 0 | 0 | 0 | 0 | 0 | 0 | 0 | 0 | 0 |
| 2025-07-20 | 0 | 0 | 0 | 0 | 0 | 0 | 0 | 0 | 0 | 0 |
| 2025-07-19 | 0 | 0 | 0 | 0 | 0 | 0 | 0 | 0 | 0 | 0 |
| 2025-07-18 | 0 | 0 | 0 | 0 | 0 | 0 | 0 | 0 | 0 | 0 |
| 2025-07-17 | 0 | 0 | 0 | 0 | 0 | 0 | 0 | 0 | 0 | 0 |
| 2025-07-16 | 0 | 0 | 0 | 0 | 0 | 0 | 0 | 0 | 0 | 0 |
| 2025-07-15 | 0 | 0 | 0 | 0 | 0 | 0 | 0 | 0 | 0 | 0 |
| 2025-07-14 | 0 | 0 | 0 | 0 | 0 | 0 | 0 | 0 | 0 | 0 |
| 2025-07-13 | 0 | 0 | 0 | 0 | 0 | 0 | 0 | 0 | 0 | 0 |
| 2025-07-12 | 0 | 0 | 0 | 0 | 0 | 0 | 0 | 0 | 0 | 0 |
| 2025-07-11 | 0 | 0 | 0 | 0 | 0 | 0 | 0 | 0 | 0 | 0 |
| 2025-07-10 | 0 | 0 | 0 | 0 | 0 | 0 | 0 | 0 | 0 | 0 |
| 2025-07-09 | 0 | 0 | 0 | 0 | 0 | 0 | 0 | 0 | 0 | 0 |
| 2025-07-08 | 0 | 0 | 0 | 0 | 0 | 0 | 0 | 0 | 0 | 0 |
| 2025-07-07 | 0 | 0 | 0 | 0 | 0 | 0 | 0 | 0 | 0 | 0 |
| 2025-07-06 | 0 | 0 | 0 | 0 | 0 | 0 | 0 | 0 | 0 | 0 |
| 2025-07-05 | 0 | 0 | 0 | 0 | 0 | 0 | 0 | 0 | 0 | 0 |
| 2025-07-04 | 0 | 0 | 0 | 0 | 0 | 0 | 0 | 0 | 0 | 0 |
| 2025-07-03 | 0 | 0 | 0 | 0 | 0 | 0 | 0 | 0 | 0 | 0 |
| 2025-07-02 | 0 | 0 | 0 | 0 | 0 | 0 | 0 | 0 | 0 | 0 |
| 2025-07-01 | 0 | 0 | 0 | 0 | 0 | 0 | 0 | 0 | 0 | 0 |
Entrainment Management
Entrainment Management for Salmonids: June 30 or after 7 days of daily mean water temperature in June ≥ 72°F (22.2°C) at Mossdale and at Prisoner’s Point (does not have to be consecutive).
| Location | Threshold (°F/°C) | Days Above (n) | Dates Above | Threshold Exceeded Date | Status |
|---|---|---|---|---|---|
| SJR at Mossdale Br [CDEC:MSD] | ≥ 72°F / 22.2°C | 8 | 06/14, 06/15, 06/16, 06/17, 06/22, 06/23, 06/24, +1 more | 06/24 | Threshold Exceeded |
| Prisoner's Point [CDEC:PPT] | ≥ 72°F / 22.2°C | 26 | 06/05, 06/06, 06/07, 06/08, 06/09, 06/10, 06/11, +19 more | 06/11 | Threshold Exceeded |
Data Notes
Content on this page is updated daily during the monitoring season and includes the most up-to-date datasets contained in the SacPAS database. Juvenile monitoring and salvage data are updated as made available publicly.
- Long-Term Operation of the Central Valley Project and State Water Project, Bay-Delta Office, USBR
- Action 5 Record of Decision, Action 5, Operation Plan for the Central Valley Project and State Water Project, USBR
- Water conditions data courtesy of CDEC.
- Knights Landing RST and Tisdale RST data courtesy of CDFW via StreamNet.
- The Knights Landing RST: uses Frank Fisher length-at-date model to categorize Chinook into "older" and "fry/smolt".
- Sacramento Trawls, Sacramento Beach Seines, Chipps Island Trawls, and Mossdale Trawls sampling data courtesy of USFWS Lodi weekly.
- Sacramento Beach Seines: Verona, Elkhorn, Sand Cove, Miller Park, Sherwood Harbor, Discovery Park, American River, Garcia Bend.
- 30 November 2020: Sampling at Mossdale Trawls stopped; sampling at the sites deemed "non-essential" during COVID-19 response.
- Salvage data courtesy of Fish Salvage Monitoring, CDFW Bay Delta Region
- Salvage Database, ftp://ftp.dfg.ca.gov/salvage/
- We use loss estimation methods as detailed in "Chinook Salmon Loss Estimation for Skinner Delta Fish Protective Facility and Tracy Fish Collection Facility, " ftp://ftp.wildlife.ca.gov/salvage/Salmon%20loss%20estimation.docx
| Hatchery | Surival Estimate Range | Source | Reference |
|---|---|---|---|
| Coleman NFH | 0.205 - 0.433 | Sandstrom et al. (2020) | Sandstrom, P.T., Ammann, A.J., Michel, C. et al. Low river survival of juvenile steelhead in the Sacramento River watershed. Environ Biol Fish 103, 531–541 (2020). |
| Feather River | 0.09 – 0.45 | Kurth (2013) | Kurth, R. 2013. Downstream migration success of Feather River Fish Hatchery steelhead smolts under different release strategies. Presentation at Steelhead Management Meeting, California Department of Fish and Wildlife. |
| Nimbus | 0.62 – 0.83 | Brodsky et al. (2020) | Brodsky, A., Zeug, S.C., Nelson, J. et al. Does broodstock source affect post-release survival of steelhead? Implications of replacing a non-native hatchery stock for recovery. Environ Biol Fish 103, 437–453 (2020). |
| Mokelumne | 0.25 – 0.33 | Del Real et al. (2012) | Del Real, S.C., Workman, M. & Merz, J. Migration characteristics of hatchery and natural-origin Oncorhynchus mykiss from the lower Mokelumne River, California. Environ Biol Fish 94, 363–375 (2012). |
- Juvenile Monitoring & Sampling data queries
- Juvenile Salvage & Loss data queries
- Loss and Salvage Predictor real-time forecasts from approximately December to mid-June