
Clear Creek Water Temperature Threshold Analysis
This page provides analysis — based on Reclamation 2025 Action 5 ROD (2026 to present), Reclamation 2019 Proposed Action (2019-2025) and RPA I.1.5 (2009-2018) — of current and historical water temperature conditions for fish using only observed data. Actual pre-season and in-season management decision processes are complex employing multiple sources of observed data, models, and forecasts. For further information, see the Thresholds section.
| Life Stage | Life Stage Dates |
Criterion | Possible Days |
Data Days |
Missing Data Days |
Total Period Analyzed | Criteria Exceedance | |||
|---|---|---|---|---|---|---|---|---|---|---|
| Average Water Temperature |
Days in Threshold |
Days | First Day | Last Day | ||||||
| Juvenile/Adults | 6/1-8/15 | Below/Equal 61°F | 76 | 61 | 1 | 58.2°F | 59 | 2 | 07/22 | 07/23 |
| Juvenile/Adults | 8/16-9/15 | Below/Equal 60°F | 0 | 0 | 0 | |||||
| Eggs/Fry | 9/16-11/15 | Below/Equal 56°F | 0 | 0 | 0 | |||||
Daily Data
| Date | Whiskeytown Dam (USBR) (WHI) River Release cfs | Clear Creek nr Igo (IGO) Flow cfs | Clear Creek nr Igo (IGO) Water Temperture F | Juvenile/Adults 61F 6/1-8/15 Status | Juvenile/Adults 60F 8/16-9/15 Status | Eggs/Fry 56F 9/16-11/15 Status |
|---|---|---|---|---|---|---|
| 2026-08-01 | 100.00 | 135.08 | 58.64 | Below | ||
| 2026-07-31 | 100.00 | 135.00 | 58.56 | Below | ||
| 2026-07-30 | 100.00 | 135.00 | 58.77 | Below | ||
| 2026-07-29 | 100.00 | 135.08 | 58.31 | Below | ||
| 2026-07-28 | 100.00 | 135.00 | 59.03 | Below | ||
| 2026-07-27 | 100.00 | 135.00 | 58.96 | Below | ||
| 2026-07-26 | 100.00 | 134.92 | 58.93 | Below | ||
| 2026-07-25 | 100.00 | 135.00 | 59.05 | Below | ||
| 2026-07-24 | 100.00 | 135.00 | 59.01 | Below | ||
| 2026-07-23 | 100.00 | 135.00 | 61.51 | Above | ||
| 2026-07-22 | 100.00 | 135.00 | 61.44 | Above | ||
| 2026-07-21 | 100.00 | 134.92 | ||||
| 2026-07-20 | 100.00 | 135.00 | 58.25 | Below | ||
| 2026-07-19 | 100.00 | 135.00 | 58.15 | Below | ||
| 2026-07-18 | 100.00 | 134.92 | 58.64 | Below | ||
| 2026-07-17 | 112.33 | 137.67 | 58.85 | Below | ||
| 2026-07-16 | 125.00 | 139.83 | 59.07 | Below | ||
| 2026-07-15 | 125.00 | 139.25 | 59.86 | Below | ||
| 2026-07-14 | 125.00 | 139.00 | 60.37 | Below | ||
| 2026-07-13 | 125.00 | 139.00 | 59.80 | Below | ||
| 2026-07-12 | 125.00 | 139.17 | 59.83 | Below | ||
| 2026-07-11 | 125.00 | 139.50 | 59.54 | Below | ||
| 2026-07-10 | 125.00 | 139.33 | 60.11 | Below | ||
| 2026-07-09 | 125.00 | 139.75 | 59.87 | Below | ||
| 2026-07-08 | 125.00 | 139.75 | 59.43 | Below | ||
| 2026-07-07 | 125.00 | 139.92 | 59.19 | Below | ||
| 2026-07-06 | 125.00 | 139.58 | 59.23 | Below | ||
| 2026-07-05 | 125.00 | 140.50 | 58.93 | Below | ||
| 2026-07-04 | 125.00 | 140.25 | 59.74 | Below | ||
| 2026-07-03 | 125.00 | 140.58 | 59.59 | Below | ||
| 2026-07-02 | 125.00 | 140.42 | 58.93 | Below | ||
| 2026-07-01 | 125.00 | 140.67 | 58.76 | Below | ||
| 2026-06-30 | 125.00 | 141.75 | 58.75 | Below | ||
| 2026-06-29 | 125.00 | 141.92 | 57.86 | Below | ||
| 2026-06-28 | 125.00 | 141.42 | 58.20 | Below | ||
| 2026-06-27 | 104.08 | 142.67 | 58.03 | Below | ||
| 2026-06-26 | 143.04 | 159.54 | 58.36 | Below | ||
| 2026-06-25 | 161.25 | 176.54 | 58.16 | Below | ||
| 2026-06-24 | 263.79 | 287.72 | 57.31 | Below | ||
| 2026-06-23 | 363.92 | 366.68 | 56.55 | Below | ||
| 2026-06-22 | 466.42 | 532.08 | 55.92 | Below | ||
| 2026-06-21 | 545.42 | 633.92 | 55.17 | Below | ||
| 2026-06-20 | 545.08 | 630.42 | 55.14 | Below | ||
| 2026-06-19 | 545.04 | 631.12 | 54.45 | Below | ||
| 2026-06-18 | 658.79 | 766.20 | 55.39 | Below | ||
| 2026-06-17 | 745.08 | 840.92 | 55.09 | Below | ||
| 2026-06-16 | 572.67 | 588.12 | 55.33 | Below | ||
| 2026-06-15 | 266.13 | 253.75 | 57.09 | Below | ||
| 2026-06-14 | 151.46 | 163.28 | 58.43 | Below | ||
| 2026-06-13 | 150.79 | 163.36 | 58.50 | Below | ||
| 2026-06-12 | 150.08 | 163.76 | 58.48 | Below | ||
| 2026-06-11 | 150.29 | 164.00 | 57.98 | Below | ||
| 2026-06-10 | 150.67 | 165.52 | 57.43 | Below | ||
| 2026-06-09 | 150.92 | 164.90 | 57.77 | Below | ||
| 2026-06-08 | 150.67 | 164.80 | 54.89 | Below | ||
| 2026-06-07 | 150.42 | 164.56 | 56.58 | Below | ||
| 2026-06-06 | 150.21 | 166.16 | 57.25 | Below | ||
| 2026-06-05 | 160.50 | 178.00 | 57.55 | Below | ||
| 2026-06-04 | 174.83 | 189.60 | 57.38 | Below | ||
| 2026-06-03 | 174.88 | 189.63 | 57.29 | Below | ||
| 2026-06-02 | 175.00 | 190.56 | 56.84 | Below | ||
| 2026-06-01 | 174.96 | 191.04 | 56.79 | Below | ||
| 2026-05-31 | 175.42 | 193.04 | 56.57 | |||
| 2026-05-30 | 175.83 | 193.76 | 56.24 | |||
| 2026-05-29 | 175.96 | 199.56 | 54.62 | |||
| 2026-05-28 | 201.88 | 223.80 | 55.85 | |||
| 2026-05-27 | 260.67 | 272.16 | 53.50 | |||
| 2026-05-26 | 365.70 | 388.72 | 53.56 | |||
| 2026-05-25 | 427.04 | 448.17 | 54.20 | |||
| 2026-05-24 | 426.96 | 447.76 | 54.31 | |||
| 2026-05-23 | 426.75 | 448.08 | 54.24 | |||
| 2026-05-22 | 426.27 | 449.32 | 54.33 | |||
| 2026-05-21 | 504.54 | 589.24 | 53.80 | |||
| 2026-05-20 | 545.58 | 640.24 | 53.44 | |||
| 2026-05-19 | 456.33 | 494.78 | 53.09 | |||
| 2026-05-18 | 291.42 | 286.50 | 53.74 | |||
| 2026-05-17 | 203.88 | 177.28 | 54.30 | |||
| 2026-05-16 | 203.83 | 216.76 | 54.08 | |||
| 2026-05-15 | 203.92 | 217.50 | 55.09 | |||
| 2026-05-14 | 203.83 | 218.20 | 55.18 | |||
| 2026-05-13 | 203.83 | 219.04 | 55.12 | |||
| 2026-05-12 | 203.92 | 219.72 | 55.86 | |||
| 2026-05-11 | 203.79 | 221.04 | 55.93 | |||
| 2026-05-10 | 203.88 | 221.04 | 55.45 | |||
| 2026-05-09 | 203.83 | 221.96 | 55.38 | |||
| 2026-05-08 | 203.83 | 223.38 | 55.37 | |||
| 2026-05-07 | 214.50 | 234.88 | 54.88 | |||
| 2026-05-06 | 228.88 | 245.28 | 54.64 | |||
| 2026-05-05 | 228.79 | 247.38 | 53.22 | |||
| 2026-05-04 | 228.88 | 245.08 | 52.96 | |||
| 2026-05-03 | 228.79 | 244.40 | 53.54 | |||
| 2026-05-02 | 228.79 | 245.20 | 54.43 | |||
| 2026-05-01 | 228.83 | 245.60 | 53.87 | |||
| 2026-04-30 | 228.88 | 246.88 | 54.05 | |||
| 2026-04-29 | 228.83 | 248.04 | 53.70 | |||
| 2026-04-28 | 228.83 | 250.68 | 53.26 | |||
| 2026-04-27 | 228.92 | 255.00 | 53.03 | |||
| 2026-04-26 | 228.79 | 255.32 | 52.40 | |||
| 2026-04-25 | 228.83 | 253.44 | 53.17 | |||
| 2026-04-24 | 228.88 | 257.04 | 53.00 | |||
| 2026-04-23 | 228.75 | 263.63 | 52.64 | |||
| 2026-04-22 | 238.33 | 302.29 | 52.00 | |||
| 2026-04-21 | 253.38 | 320.92 | 51.62 | |||
| 2026-04-20 | 253.88 | 271.52 | 51.29 | |||
| 2026-04-19 | 253.88 | 269.12 | 52.58 | |||
| 2026-04-18 | 253.83 | 269.24 | 52.15 | |||
| 2026-04-17 | 253.88 | 270.68 | 51.61 | |||
| 2026-04-16 | 253.96 | 272.48 | 51.43 | |||
| 2026-04-15 | 253.88 | 275.36 | 51.90 | |||
| 2026-04-14 | 253.88 | 278.84 | 51.86 | |||
| 2026-04-13 | 253.83 | 288.56 | 51.76 | |||
| 2026-04-12 | 253.92 | 316.68 | 50.60 | |||
| 2026-04-11 | 253.83 | 274.88 | 51.35 | |||
| 2026-04-10 | 253.83 | 270.44 | 51.74 | |||
| 2026-04-09 | 253.92 | 268.64 | 52.27 | |||
| 2026-04-08 | 253.83 | 268.40 | 52.08 | |||
| 2026-04-07 | 253.88 | 268.52 | 52.27 | |||
| 2026-04-06 | 262.92 | 277.16 | 52.21 | |||
| 2026-04-05 | 279.88 | 286.64 | 51.93 | |||
| 2026-04-04 | 279.88 | 287.12 | 51.59 | |||
| 2026-04-03 | 279.88 | 287.84 | 51.11 | |||
| 2026-04-02 | 279.92 | 289.76 | 50.95 | |||
| 2026-04-01 | 279.88 | 292.64 | 51.19 | |||
| 2026-03-31 | 279.92 | 292.04 | 50.89 | |||
| 2026-03-30 | 279.79 | 290.00 | 51.32 | |||
| 2026-03-29 | 279.92 | 290.12 | 51.68 | |||
| 2026-03-28 | 279.88 | 290.72 | 51.58 | |||
| 2026-03-27 | 279.83 | 291.80 | 51.27 | |||
| 2026-03-26 | 276.38 | 290.60 | 51.05 | |||
| 2026-03-25 | 279.71 | 293.96 | 51.60 | |||
| 2026-03-24 | 279.63 | 295.64 | 51.78 | |||
| 2026-03-23 | 279.71 | 296.00 | 51.53 | |||
| 2026-03-22 | 279.42 | 297.56 | 51.66 | |||
| 2026-03-21 | 279.33 | 299.12 | 51.87 | |||
| 2026-03-20 | 279.50 | 300.13 | 51.85 | |||
| 2026-03-19 | 279.46 | 301.88 | 51.80 | |||
| 2026-03-18 | 279.63 | 304.52 | 51.62 | |||
| 2026-03-17 | 279.75 | 307.76 | 51.55 | |||
| 2026-03-16 | 288.83 | 318.96 | 51.24 | |||
| 2026-03-15 | 301.79 | 330.04 | 50.78 | |||
| 2026-03-14 | 301.75 | 331.60 | 50.78 | |||
| 2026-03-13 | 301.79 | 333.88 | 50.30 | |||
| 2026-03-12 | 301.79 | 334.96 | 49.90 | |||
| 2026-03-11 | 302.00 | 336.12 | 49.76 | |||
| 2026-03-10 | 301.88 | 339.63 | 50.03 | |||
| 2026-03-09 | 301.92 | 343.76 | 50.20 | |||
| 2026-03-08 | 301.96 | 347.29 | 50.59 | |||
| 2026-03-07 | 301.83 | 351.04 | 50.05 | |||
| 2026-03-06 | 302.08 | 356.36 | 49.10 | |||
| 2026-03-05 | 302.83 | 362.96 | 49.01 | |||
| 2026-03-04 | 302.88 | 372.80 | 49.75 | |||
| 2026-03-03 | 302.96 | 384.44 | 49.87 | |||
| 2026-03-02 | 303.17 | 400.64 | 50.57 | |||
| 2026-03-01 | 303.58 | 422.20 | 51.05 | |||
| 2026-02-28 | 303.58 | 451.96 | 51.36 | |||
| 2026-02-27 | 303.08 | 499.48 | 51.47 | |||
| 2026-02-26 | 302.83 | 615.84 | 51.38 | |||
| 2026-02-25 | 302.33 | 1020.88 | 52.10 | |||
| 2026-02-24 | 301.83 | 1419.76 | 50.61 | |||
| 2026-02-23 | 301.29 | 372.20 | 48.60 | |||
| 2026-02-22 | 301.21 | 371.84 | 47.99 | |||
| 2026-02-21 | 301.71 | 381.38 | 47.62 | |||
| 2026-02-20 | 301.83 | 412.68 | 47.03 | |||
| 2026-02-19 | 301.83 | 429.84 | 47.12 | |||
| 2026-02-18 | 301.92 | 383.20 | 47.05 | |||
| 2026-02-17 | 301.63 | 399.48 | 47.42 | |||
| 2026-02-16 | 301.88 | 392.60 | 48.74 | |||
| 2026-02-15 | 301.71 | 321.00 | 48.79 | |||
| 2026-02-14 | 301.92 | 312.12 | 48.73 | |||
| 2026-02-13 | 301.88 | 316.08 | 48.85 | |||
| 2026-02-12 | 302.21 | 325.60 | 49.27 | |||
| 2026-02-11 | 301.96 | 333.16 | 48.89 | |||
| 2026-02-10 | 301.83 | 305.48 | 48.68 | |||
| 2026-02-09 | 249.88 | 305.36 | 48.60 | |||
| 2026-02-08 | 268.13 | 306.32 | 48.90 | |||
| 2026-02-07 | 302.04 | 305.72 | 48.27 | |||
| 2026-02-06 | 302.08 | 306.80 | 48.03 | |||
| 2026-02-05 | 301.88 | 307.72 | 48.13 | |||
| 2026-02-04 | 296.96 | 308.68 | 48.29 | |||
| 2026-02-03 | 301.96 | 309.60 | 48.34 | |||
| 2026-02-02 | 301.92 | 311.36 | 48.53 | |||
| 2026-02-01 | 302.79 | 312.04 | 48.28 | |||
| 2026-01-31 | 302.58 | 312.24 | 48.20 | |||
| 2026-01-30 | 302.33 | 313.70 | 48.35 | |||
| 2026-01-29 | 302.63 | 315.12 | 48.37 | |||
| 2026-01-28 | 303.08 | 317.52 | 48.77 | |||
| 2026-01-27 | 303.83 | 317.28 | 47.98 | |||
| 2026-01-26 | 303.13 | 318.24 | 47.65 | |||
| 2026-01-25 | 302.79 | 319.32 | 47.70 | |||
| 2026-01-24 | 302.50 | 321.48 | 48.30 | |||
| 2026-01-23 | 303.29 | 323.92 | 48.47 | |||
| 2026-01-22 | 304.17 | 327.60 | 49.15 | |||
| 2026-01-21 | 304.54 | 330.04 | 48.96 | |||
| 2026-01-20 | 305.58 | 332.92 | 48.75 | |||
| 2026-01-19 | 305.63 | 336.64 | 49.03 | |||
| 2026-01-18 | 306.58 | 340.48 | 48.84 | |||
| 2026-01-17 | 306.96 | 344.96 | 48.73 | |||
| 2026-01-16 | 306.88 | 352.20 | 49.24 | |||
| 2026-01-15 | 303.33 | 358.46 | 49.31 | |||
| 2026-01-14 | 307.00 | 366.32 | 49.18 | |||
| 2026-01-13 | 306.00 | 375.92 | 48.80 | |||
| 2026-01-12 | 307.00 | 388.60 | 48.97 | |||
| 2026-01-11 | 307.00 | 404.70 | 48.77 | |||
| 2026-01-10 | 307.00 | 432.58 | 48.79 | |||
| 2026-01-09 | 307.00 | 467.92 | 48.58 | |||
| 2026-01-08 | 307.00 | 538.04 | 48.86 | |||
| 2026-01-07 | 307.00 | 668.80 | 50.85 | |||
| 2026-01-06 | 307.00 | 1053.04 | 52.21 | |||
| 2026-01-05 | 289.00 | 1534.24 | 51.67 | |||
| 2026-01-04 | 279.00 | 749.40 | 51.65 | |||
| 2026-01-03 | 278.00 | 734.16 | 51.80 | |||
| 2026-01-02 | 277.00 | 509.00 | 51.13 | |||
| 2026-01-01 | 277.00 | 368.12 | 50.53 |
Data Methods & Notes
Methods
- Data Courtesy of CDEC and US Geological Survey
- Hourly data for Clear Creek nr Igo (IGO) is retrieved from CDEC on a daily basis.
- Columbia Basin Research (CBR) QA/QC process on IGO hourly data for outliers, false data (e.g., 32°F measured by satellite), and data outside expected range of observation (e.g., 90°F). Data loaded into CBR database.
- CBR calculates Daily Average values based on CBR cleaned hourly values.
- Query for daily average water temperature for selected year.
- Examine daily average data for 60°F and 56°F exceedance during date periods as outlined in Reclamation Proposed Action.
Thresholds
Please refer to the Clear Creek Technical Team (CCTT) annual reports for details on within water year activities.
Target analysis and exceedance found on this page is based on criteria as described in Reclamation 2025, p3-6.
[Reclamation] US Bureau of Reclamation. 2025. Action 5, Record of Decision, Attachment 1, Exhibit 1, Operation Plan for the Long-Term Operations of the Central Valley Project and State Water Project. Signed Action 5 Record of Decision posted 12/04/2025. Available online: https://www.usbr.gov/mp/bdo/lto/.
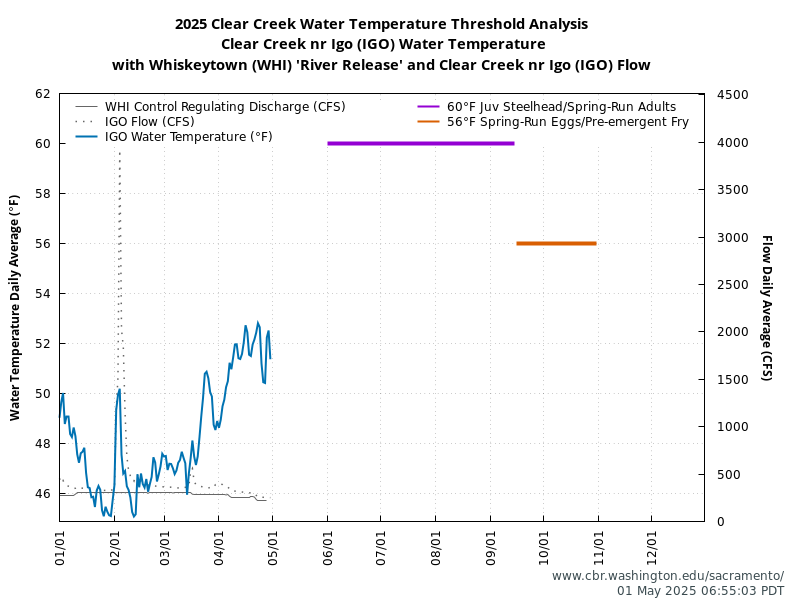
Water temperature management addresses adult water temperature and egg incubation stressors. Reclamation would target Whiskeytown Dam releases to not exceed the mean daily temperatures at Igo gauge:
- 61°F from June 1 through August 15
- 60°F from August 16 through September 15
- 56°F from September 16 through November 15
If two consecutive days of mean daily temperature are exceeded, and Reclamation determines additional water is available, then 25 cfs per day may be added to the base flow to address temperatures. Before spawning (in the late spring or summer) a return to base flow would occur when meteorological conditions allow. After spawning (later-summer or fall) flow changes for temperature management would be maintained until the base flow of the seasonal hydrograph rises to meet the elevated temperature release so as to avoid dewatering redds.
Water temperature management on Clear Creek is implemented through changes in guard gate configurations and flow manipulations. In dry, critical, or import curtailment years, Reclamation may not be able to meet these temperatures and would operate Whiskeytown Dam as close to these temperatures as practicable.