WY2023 Current Conditions for the Stanislaus Watershed Team -- ARCHIVE
Content on this page is updated daily and includes the most up-to-date datasets contained in the SacPAS database.
SacPAS Related Queries and Tools:
- Juvenile Monitoring & Sampling data queries
- River Conditions data queries
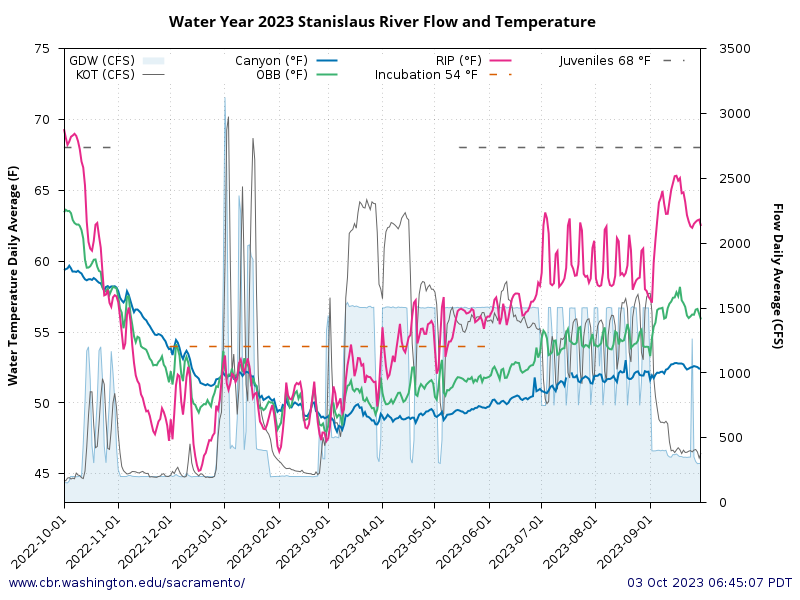
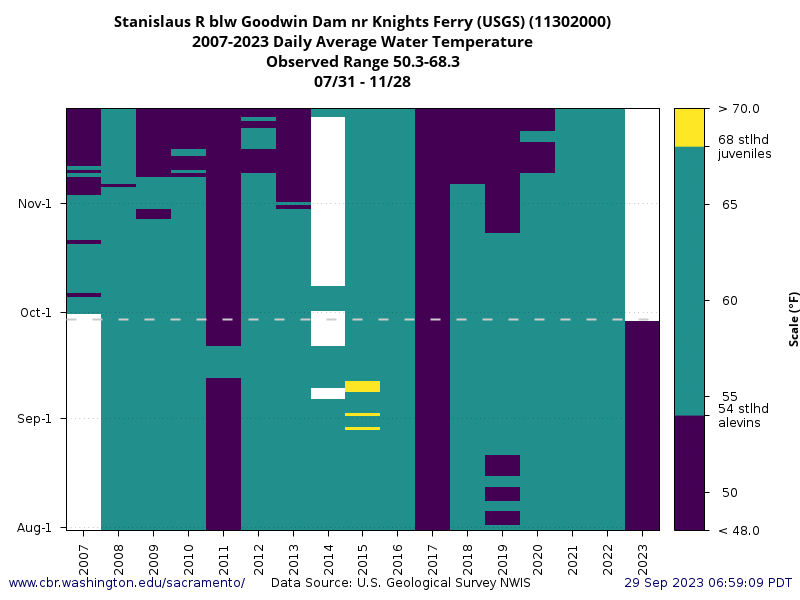
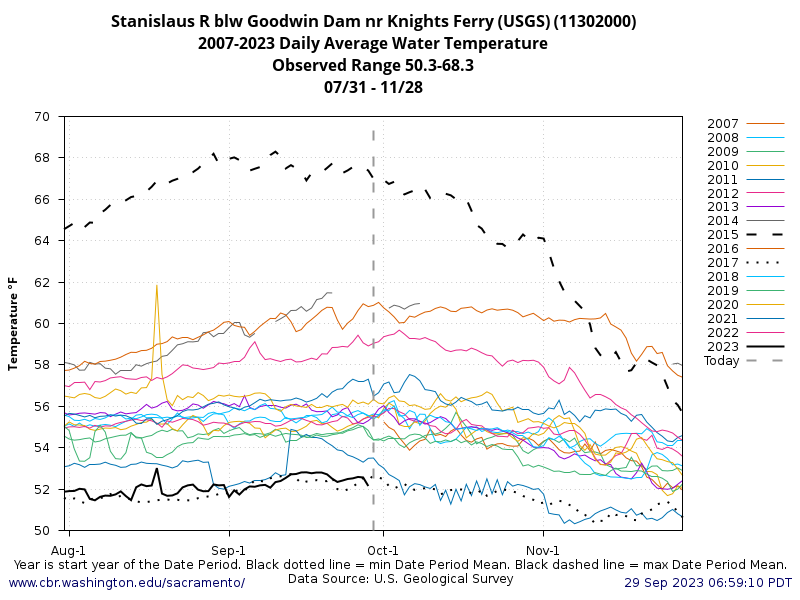
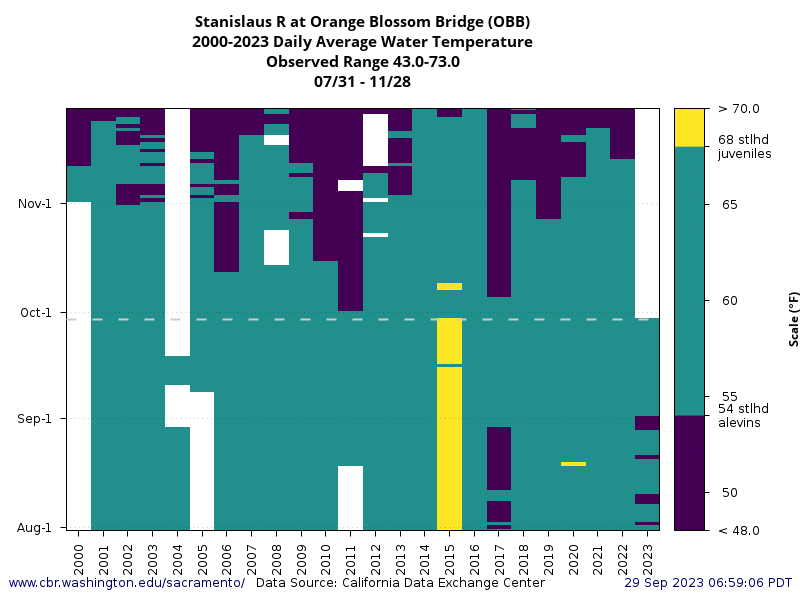
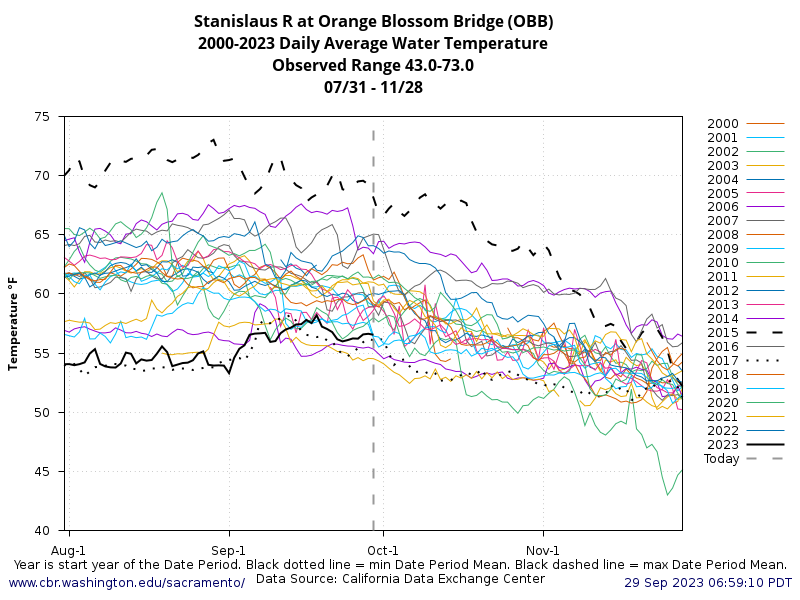
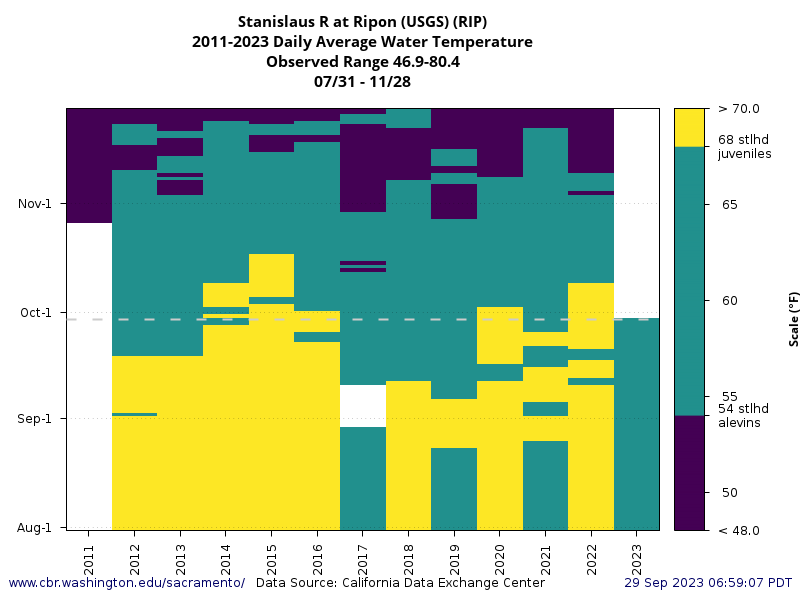
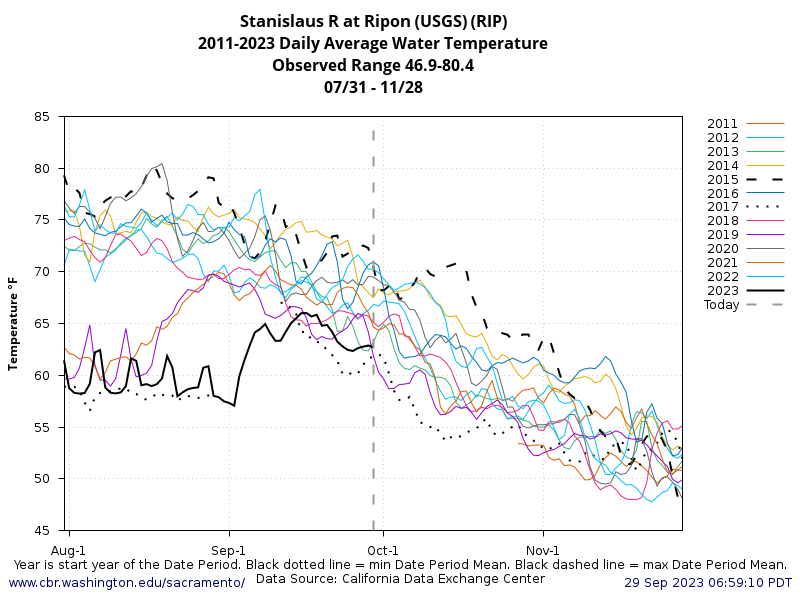
Stanislaus Temperature and Flow
Juvenile Sampling
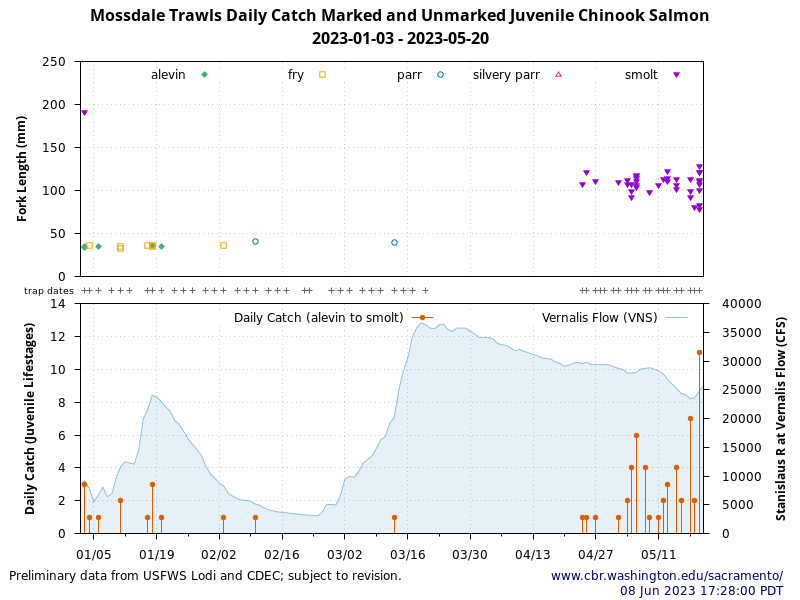
2023 Mossdale Trawls Juvenile Chinook Sampling
| Date | Species | Catch | Fork Length (mm) | Markcode | Lifestage |
|---|---|---|---|---|---|
| Date | Species | Catch | Fork Length (mm) | Markcode | Lifestage |
| 2023-01-03 | Chinook | 1 | 33 | None | alevin |
| 2023-01-03 | Chinook | 1 | 35 | None | alevin |
| 2023-01-03 | Chinook | 1 | 190 | AdClipped | smolt |
| 2023-01-04 | Chinook | 1 | 36 | None | fry |
| 2023-01-06 | Chinook | 1 | 35 | None | alevin |
| 2023-01-11 | Chinook | 1 | 32 | None | fry |
| 2023-01-11 | Chinook | 1 | 35 | None | fry |
| 2023-01-17 | Chinook | 1 | 36 | None | fry |
| 2023-01-18 | Chinook | 1 | 36 | None | alevin |
| 2023-01-18 | Chinook | 1 | 35 | None | fry |
| 2023-01-18 | Chinook | 1 | 36 | None | fry |
| 2023-01-20 | Chinook | 1 | 35 | None | alevin |
| 2023-02-03 | Chinook | 1 | 36 | None | fry |
| 2023-02-10 | Chinook | 1 | 40 | None | parr |
| 2023-03-13 | Chinook | 1 | 39 | None | parr |
| 2023-04-24 | Chinook | 1 | 107 | AdClipped | smolt |
| 2023-04-25 | Chinook | 1 | 120 | AdClipped | smolt |
| 2023-04-27 | Chinook | 1 | 110 | AdClipped | smolt |
| 2023-05-02 | Chinook | 1 | 109 | N/P | smolt |
| 2023-05-04 | Chinook | 1 | 107 | N/P | smolt |
| 2023-05-04 | Chinook | 1 | 111 | AdClipped | smolt |
| 2023-05-05 | Chinook | 1 | 92 | N/P | smolt |
| 2023-05-05 | Chinook | 1 | 92 | N/P | smolt |
| 2023-05-05 | Chinook | 1 | 99 | N/P | smolt |
| 2023-05-05 | Chinook | 1 | 107 | N/P | smolt |
| 2023-05-06 | Chinook | 1 | 103 | N/P | smolt |
| 2023-05-06 | Chinook | 1 | 105 | N/P | smolt |
| 2023-05-06 | Chinook | 1 | 110 | N/P | smolt |
| 2023-05-06 | Chinook | 1 | 114 | N/P | smolt |
| 2023-05-06 | Chinook | 1 | 116 | N/P | smolt |
| 2023-05-06 | Chinook | 1 | 117 | N/P | smolt |
| 2023-05-08 | Chinook | 1 | 80 | N/P | |
| 2023-05-08 | Chinook | 1 | 82 | N/P | |
| 2023-05-08 | Chinook | 1 | 83 | N/P | |
| 2023-05-08 | Chinook | 1 | 96 | N/P | |
| 2023-05-09 | Chinook | 1 | 97 | N/P | smolt |
| 2023-05-11 | Chinook | 1 | 105 | N/P | smolt |
| 2023-05-12 | Chinook | 1 | 86 | N/P | |
| 2023-05-12 | Chinook | 1 | 112 | N/P | smolt |
| 2023-05-13 | Chinook | 1 | 110 | N/P | smolt |
| 2023-05-13 | Chinook | 1 | 114 | N/P | smolt |
| 2023-05-13 | Chinook | 1 | 122 | N/P | smolt |
| 2023-05-15 | Chinook | 1 | 70 | N/P | |
| 2023-05-15 | Chinook | 1 | 101 | N/P | smolt |
| 2023-05-15 | Chinook | 1 | 105 | N/P | smolt |
| 2023-05-15 | Chinook | 1 | 112 | N/P | smolt |
| 2023-05-16 | Chinook | 1 | 68 | N/P | |
| 2023-05-16 | Chinook | 1 | 83 | N/P | |
| 2023-05-18 | Chinook | 1 | 67 | N/P | |
| 2023-05-18 | Chinook | 1 | 73 | N/P | |
| 2023-05-18 | Chinook | 1 | 77 | n/p | |
| 2023-05-18 | Chinook | 1 | 91 | N/P | |
| 2023-05-18 | Chinook | 1 | 91 | N/P | smolt |
| 2023-05-18 | Chinook | 1 | 98 | N/P | smolt |
| 2023-05-18 | Chinook | 1 | 112 | N/P | smolt |
| 2023-05-19 | Chinook | 1 | 80 | N/P | smolt |
| 2023-05-19 | Chinook | 1 | 80 | N/P | smolt |
| 2023-05-20 | Chinook | 1 | 77 | N/P | smolt |
| 2023-05-20 | Chinook | 1 | 82 | N/P | smolt |
| 2023-05-20 | Chinook | 1 | 100 | N/P | smolt |
| 2023-05-20 | Chinook | 1 | 107 | N/P | smolt |
| 2023-05-20 | Chinook | 1 | 110 | N/P | smolt |
| 2023-05-20 | Chinook | 1 | 110 | N/P | smolt |
| 2023-05-20 | Chinook | 1 | 111 | N/P | smolt |
| 2023-05-20 | Chinook | 1 | 111 | N/P | smolt |
| 2023-05-20 | Chinook | 1 | 120 | N/P | smolt |
| 2023-05-20 | Chinook | 1 | 121 | N/P | smolt |
| 2023-05-20 | Chinook | 1 | 128 | N/P | smolt |
Preliminary data from USFWS Lodi; subject to revision. Table generated by SacPAS.
Updated: Thursday, 08-Jun-2023 17:28:02 PDT
Juvenile Sampling Summary for 09/15/2023-09/28/2023 (last 14 days) and 09/01/2023-09/14/2023 (previous 14 days)
| Date Range | Data Item | Caswell Memorial State Park RSTs | Mossdale Trawls | Antioch Dunes SJ001S | Eddo's SJ005N | Medford Island SJ026S | Lost Isle SJ032S | Dad's Point SJ041N | Dos Reis SJ051E | Mossdale SJ056E | Weatherbee SJ058W | Big Beach SJ063W | Durham Site SJ068W | Sturgeon Bend SJ074W | Two Rivers RV Park SJ075E | Route 132 SJ077E | N. of Tuol. R. SJ083W |
|---|---|---|---|---|---|---|---|---|---|---|---|---|---|---|---|---|---|
| Date Range | Data Item | Caswell Memorial State Park RSTs | Mossdale Trawls | Antioch Dunes SJ001S | Eddo's SJ005N | Medford Island SJ026S | Lost Isle SJ032S | Dad's Point SJ041N | Dos Reis SJ051E | Mossdale SJ056E | Weatherbee SJ058W | Big Beach SJ063W | Durham Site SJ068W | Sturgeon Bend SJ074W | Two Rivers RV Park SJ075E | Route 132 SJ077E | N. of Tuol. R. SJ083W |
| 09/15/2023-09/28/2023 | Min Sample Date | 2023-09-15 | 2023-09-18 | 2023-09-21 | 2023-09-15 | 2023-09-21 | |||||||||||
| 09/15/2023-09/28/2023 | Max Sample Date | 2023-09-22 | 2023-09-18 | 2023-09-21 | 2023-09-21 | 2023-09-21 | |||||||||||
| 09/15/2023-09/28/2023 | Days with Sampling | 0 | 0 | 0 | 0 | 0 | 0 | 0 | 0 | 0 | 0 | 0 | 0 | 0 | 0 | 0 | 0 |
| 09/15/2023-09/28/2023 | Fall Chinook | 0 | 0 | 0 | 0 | 0 | |||||||||||
| 09/15/2023-09/28/2023 | Spring Chinook | 0 | 0 | 0 | 0 | 0 | |||||||||||
| 09/15/2023-09/28/2023 | Winter Chinook | 0 | 0 | 0 | 0 | 0 | |||||||||||
| 09/15/2023-09/28/2023 | LateFall Chinook | 0 | 0 | 0 | 0 | 0 | |||||||||||
| 09/15/2023-09/28/2023 | Chinook (ad-clip) | 0 | 0 | 0 | 0 | 0 | |||||||||||
| 09/15/2023-09/28/2023 | Steelhead (natural) | 0 | 0 | 0 | 0 | 0 | |||||||||||
| 09/15/2023-09/28/2023 | Steelhead (ad-clip) | 0 | 0 | 0 | 0 | 0 | |||||||||||
| 09/15/2023-09/28/2023 | Avg Flow (cfs) | ||||||||||||||||
| 09/15/2023-09/28/2023 | Avg Water Temp (F) | 32.0 | 70.0 | 70.0 | 72.3 | 72.4 | 70.3 | ||||||||||
| 09/15/2023-09/28/2023 | Avg Turbidity (NTU) | 16.6 | 21.2 | 35.0 | 13.1 | 16.0 | |||||||||||
| 09/01/2023-09/14/2023 | Min Sample Date | 2023-09-01 | 2023-09-07 | 2023-09-07 | 2023-09-07 | ||||||||||||
| 09/01/2023-09/14/2023 | Max Sample Date | 2023-09-13 | 2023-09-13 | 2023-09-07 | 2023-09-07 | ||||||||||||
| 09/01/2023-09/14/2023 | Days with Sampling | 0 | 0 | 0 | 0 | 0 | 0 | 0 | 0 | 0 | 0 | 0 | 0 | 0 | 0 | 0 | 0 |
| 09/01/2023-09/14/2023 | Fall Chinook | 0 | 0 | 0 | 0 | ||||||||||||
| 09/01/2023-09/14/2023 | Spring Chinook | 0 | 0 | 0 | 0 | ||||||||||||
| 09/01/2023-09/14/2023 | Winter Chinook | 0 | 0 | 0 | 0 | ||||||||||||
| 09/01/2023-09/14/2023 | LateFall Chinook | 0 | 0 | 0 | 0 | ||||||||||||
| 09/01/2023-09/14/2023 | Chinook (ad-clip) | 0 | 0 | 0 | 0 | ||||||||||||
| 09/01/2023-09/14/2023 | Steelhead (natural) | 0 | 0 | 0 | 0 | ||||||||||||
| 09/01/2023-09/14/2023 | Steelhead (ad-clip) | 0 | 0 | 0 | 0 | ||||||||||||
| 09/01/2023-09/14/2023 | Avg Flow (cfs) | 673.6 | 2545.8 | ||||||||||||||
| 09/01/2023-09/14/2023 | Avg Water Temp (F) | 32.0 | 69.8 | 72.1 | 72.7 | 71.1 | |||||||||||
| 09/01/2023-09/14/2023 | Avg Turbidity (NTU) | 20.9 | 15.4 | 17.4 | 28.1 | ||||||||||||
| source of Avg Flow (cfs) | Ripon USGS (RIP) | Vernalis (VNS) | |||||||||||||||
| source of Avg Water Temp (F) | Caswell RST | Vernalis (VNS) | Antioch Dunes | Eddo's | Medford Island | Lost Isle | Dad's Point | Dos Reis | Mossdale | Weatherbee | Big Beach | Durham Site | Sturgeon Bend | Two Rivers RV Park | Route 132 | N. of Tuol. R. | |
| source of Avg Turbidity (NTU) | Caswell RSTs | Mossdale Trawls | Antioch Dunes | Eddo's | Medford Island | Lost Isle | Dad's Point | Dos Reis | Mossdale | Weatherbee | Big Beach | Durham Site | Sturgeon Bend | Two Rivers RV Park | Route 132 | N. of Tuol. R. |
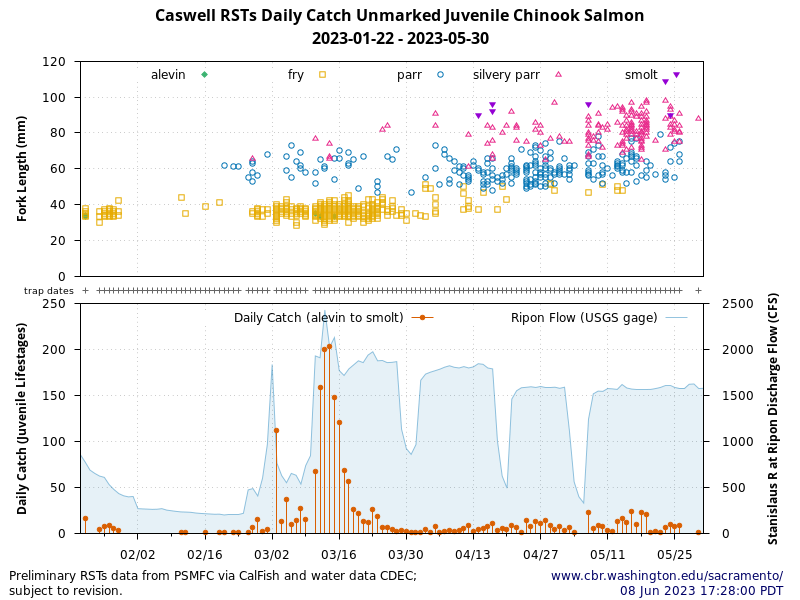
- Caswell Memorial State Park RSTs: Preliminary data from PSMFC via StreamNet and CDEC; subject to revision.
- Mossdale Trawls: Preliminary data from USFWS Lodi and CDEC; subject to revision.
- Antioch Dunes Beach Seine: Preliminary data from USFWS Lodi and CDEC; subject to revision.
- Eddo's Beach Seine: Preliminary data from USFWS Lodi and CDEC; subject to revision.
- Medford Island Beach Seine: Preliminary data from USFWS Lodi and CDEC; subject to revision.
- Lost Isle Beach Seine: Preliminary data from USFWS Lodi and CDEC; subject to revision.
- Dad's Point Beach Seine: Preliminary data from USFWS Lodi and CDEC; subject to revision.
- Dos Reis Beach Seine: Preliminary data from USFWS Lodi and CDEC; subject to revision.
- Mossdale Beach Seine: Preliminary data from USFWS Lodi and CDEC; subject to revision.
- Weatherbee Beach Seine: Preliminary data from USFWS Lodi and CDEC; subject to revision.
- Big Beach Beach Seine: Preliminary data from USFWS Lodi and CDEC; subject to revision.
- Durham Site Beach Seine: Preliminary data from USFWS Lodi and CDEC; subject to revision.
- Sturgeon Bend Beach Seine: Preliminary data from USFWS Lodi and CDEC; subject to revision.
- Two Rivers RV Park Beach Seine: Preliminary data from USFWS Lodi and CDEC; subject to revision.
- Route 132 Beach Seine: Preliminary data from USFWS Lodi and CDEC; subject to revision.
- N. of Tuol. R. Beach Seine: Preliminary data from USFWS Lodi and CDEC; subject to revision.
- Averages: calculated for all non-null data points within the 7 day reporting period.
Data retrieved from PSMFC via CalFish, CDEC, DatCall email distribution. Figure and Table generated by SacPAS.
Updated: Friday, 29-Sep-2023 16:19:00 PDT
Current River Conditions
Stanislaus Watershed Select River Conditions for 2023-09-28
| Stanislaus | Tuolumne | Merced | San Joaquin | |||||||||||||
|---|---|---|---|---|---|---|---|---|---|---|---|---|---|---|---|---|
| Location | GDW | OBB | RIP | KOT | LGN | TRW | MOD | TRT | MBH | CRS | MST | NEW | MRB | VNS | MSD | OH1 |
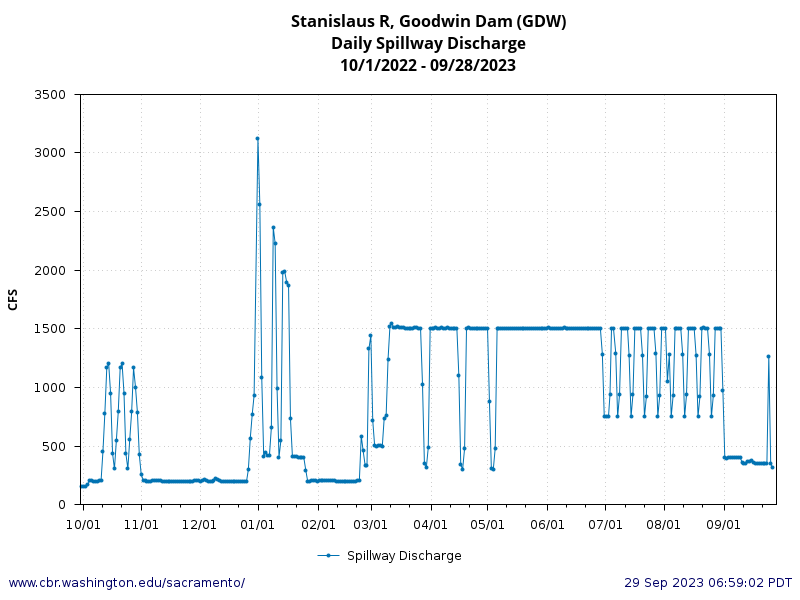
| Flow (CFS) | 318 a | |||||||||||||||
Note: a. Data is not available for 2023-09-28. Most recent data up to 5 days prior is reported.
| Stanislaus | Tuolumne | Merced | San Joaquin | |||||
|---|---|---|---|---|---|---|---|---|
| Location | OBB | RIP | RPN | MOD | CRS | VNS | MSD | OH1 |
| Water Temperature (°F) | 56.6 | 62.9 | 64.0 | 64.1 | 65.5 | 67.9 | 68.9 | 68.7 |
| Stanislaus | Tuolumne | San Joaquin | |
|---|---|---|---|
| Location | GDW | TLG | SJF |
| Full Natural Flow (CFS) |
| Stanislaus | Tuolumne | Merced | San Joaquin | |
|---|---|---|---|---|
| Location | NML | DNP | EXC | MIL |
| Reservoir Storage (TAF) | 1897 | 1722 | 753 | 220 |
| Res Above Top of Conserv Stor (TAF) | -404 a | -80 a | -116 a | -298 a |
| Reservoir Inflow (CFS) | ||||
| Reservoir Outflow (CFS) |
Note: a. Data is not available for 2023-09-28. Most recent data up to 5 days prior is reported.
| Stanislaus | San Joaquin | ||
|---|---|---|---|
| Location | RPN | MSD | OH1 |
| Dissolved Oxygen (mg/L) | 9.3 | 8.5 | 8.5 |
Data retrieved from CDEC; Current River Conditions tables generated by SacPAS.
Updated: Friday, 29-Sep-2023 06:59:00 PDT
Water Temperature Min, Max, Average
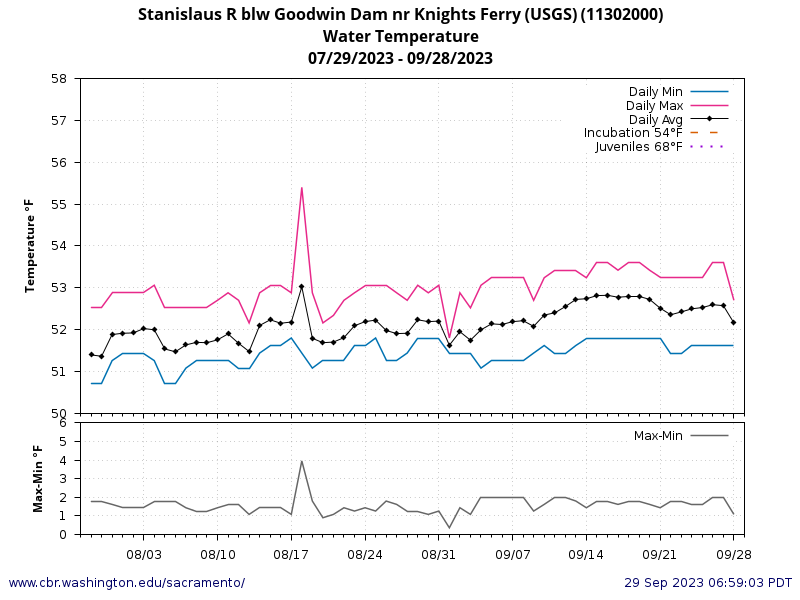
Extended Date Range Charts
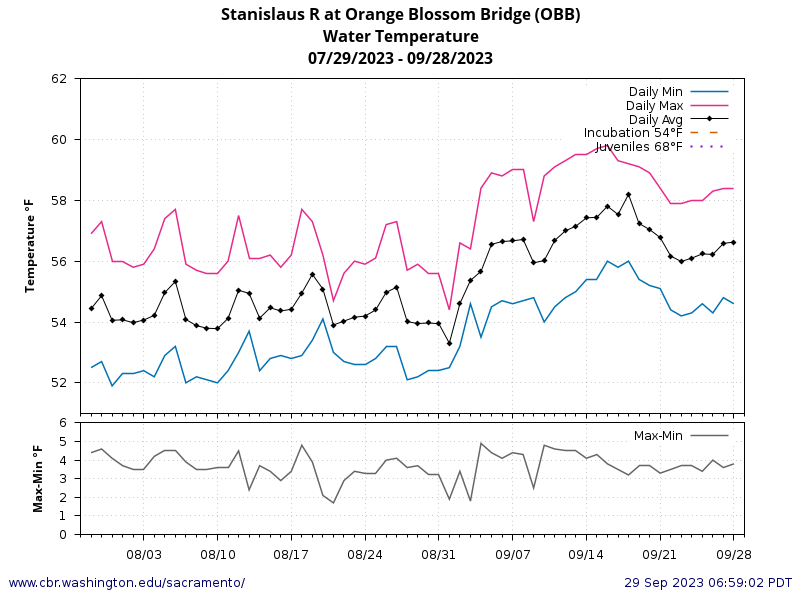
Extended Date Range Charts
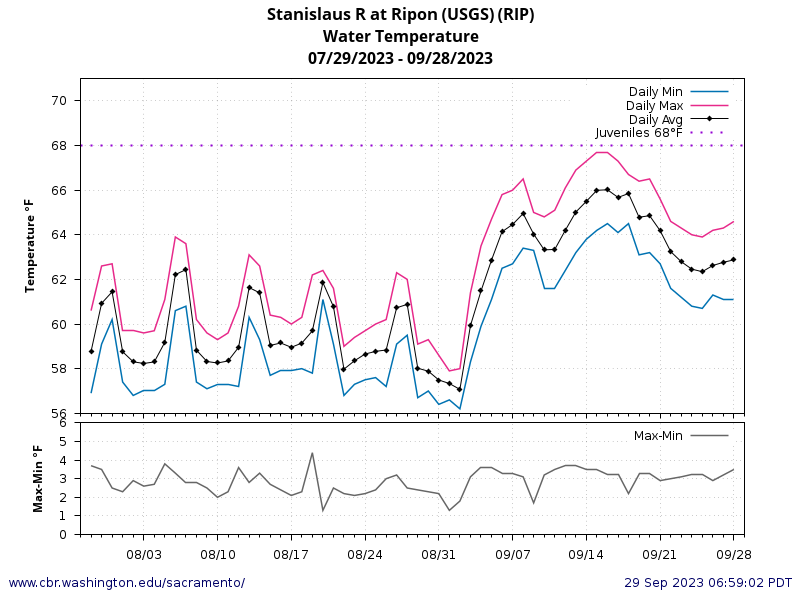
Extended Date Range Charts
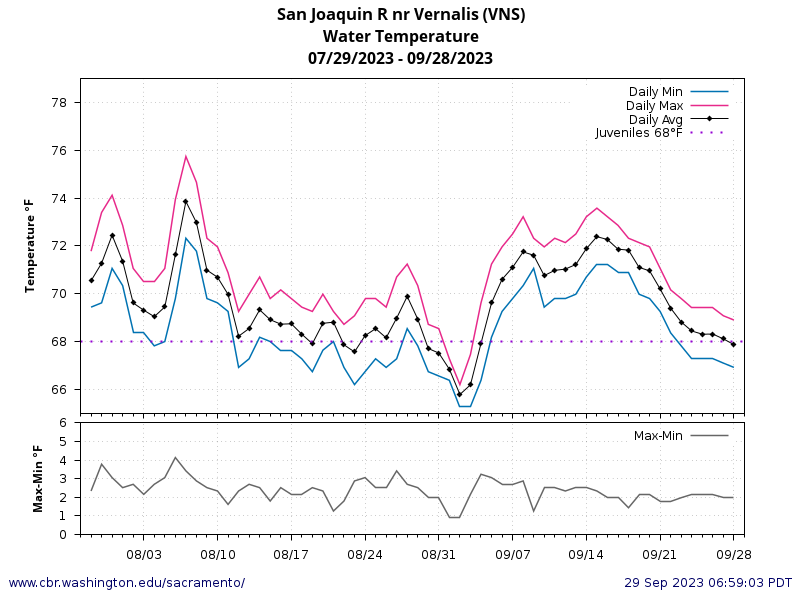
Extended Date Range Charts
Water Temperature Historical
Goodwin Dam Spillway Discharge