Columbia Basin Annual Trends
Columbia Basin Annual Trends — An interactive display of status and trends monitoring data with compliance graphics for wild and hatchery adult and smolt salmon. These analyses were prompted by the need to research, monitor, and evaluate compliance pursuant to the Federal Columbia River Power System 2004 Biological Opinion Remand Updated Proposed Action (UPA). The database allows users to assess the compliance using decadal means and decadal trends and includes graphs on Adult Escapement, Adult Passage Counts, CWT SARs, PIT Tag Survival and Travel Time analysis, Harvest Estimates, and hydrosystem conditions (Temperature, Dissolved Gas Percent, Outflow).
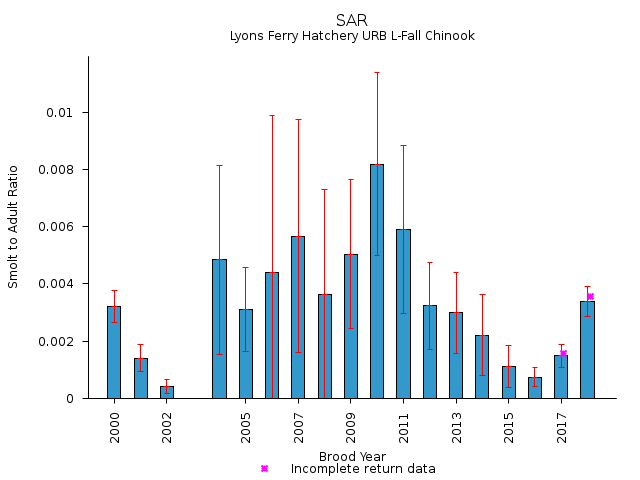
ROSTER Results
ROSTER Results — Webpages contain interactive displays of status and trends monitoring data for hatchery adult and smolt salmon. The goal of these summaries is to assist in monitoring salmonid migrations pursuant to the Federal Columbia River Power System 2004 Biological Opinion Remand Updated Proposed Action (UPA). Users can assess graphs of SAR; smolt, ocean, and adult survival; transport-inriver ratios; and 'D', based on PIT-tag data.
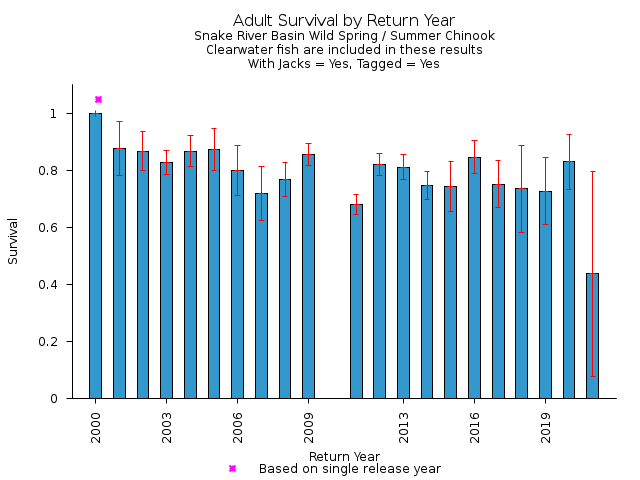
PIT Tag Survival and Travel Time
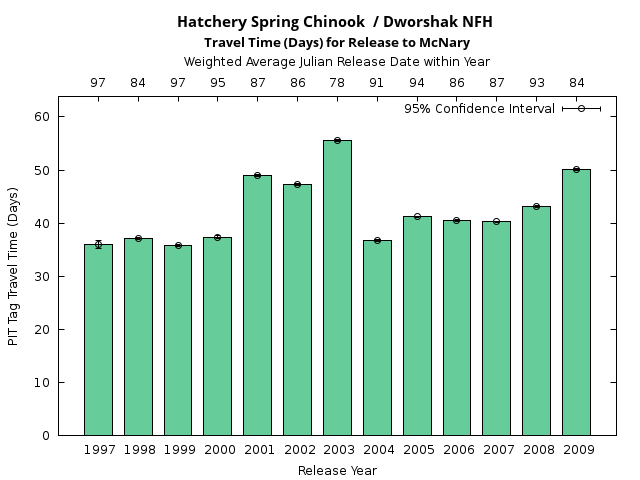
PIT Tag Survival and Travel Time Analysis — survival and travel time analysis and plots for Columbia Basin PIT-tagged hatchery and wild salmon. The PIT Tag Survival and Travel Time Analysis data includes: 1) Cormack Jolly-Seber Survival estimates for Release to Lower Granite, McNary, and John Day as well as single reach estimates (e.g., Lower Granite to Little Goose) and combined reach estimates (e.g., Lower Granite to McNary); 2) Travel Time estimates for Release to Lower Granite, McNary, and John Day as well as Lower Granite to McNary where appropriate; and 3) Detection Probability estimates at various project locations on the Columbia and Snake rivers.
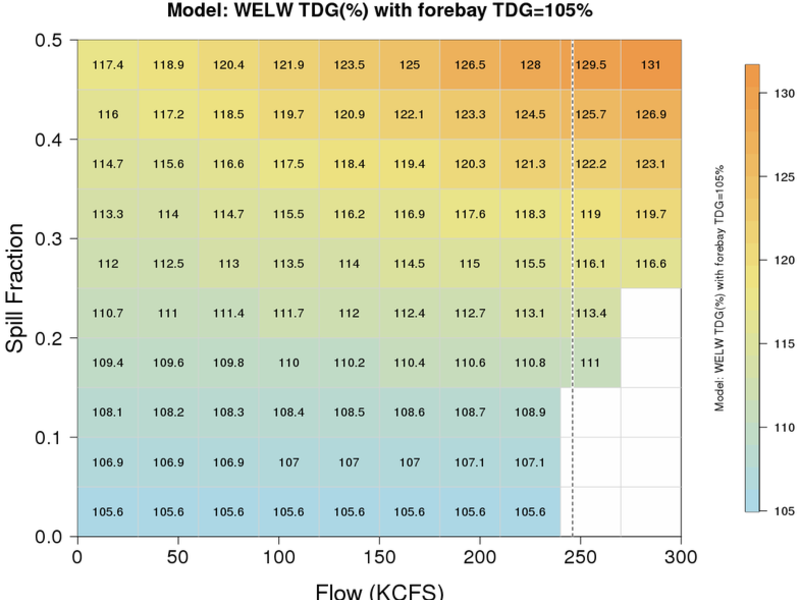
Dam Conditions
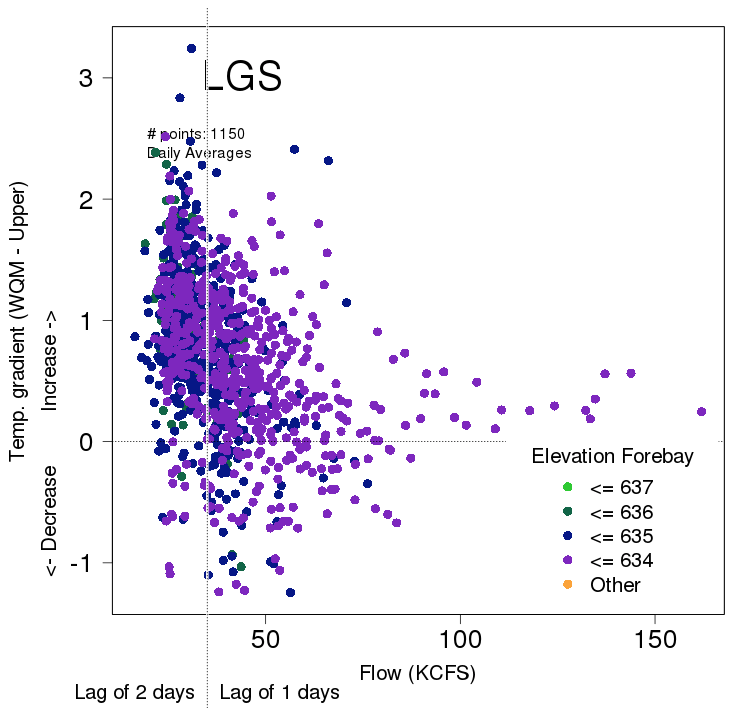
Reservoir Conditions
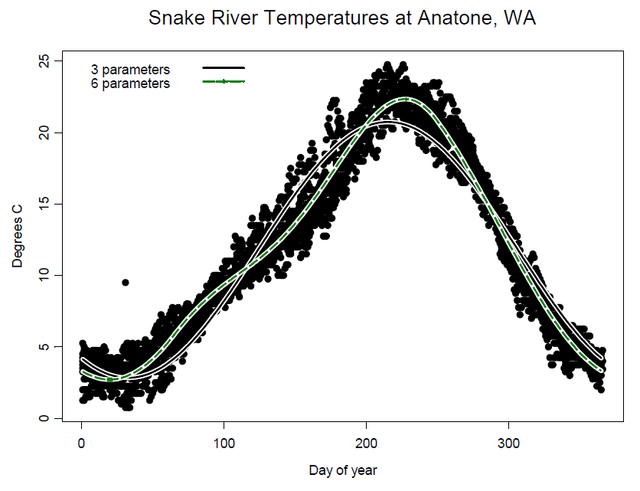
Predicted Stream Temperatures
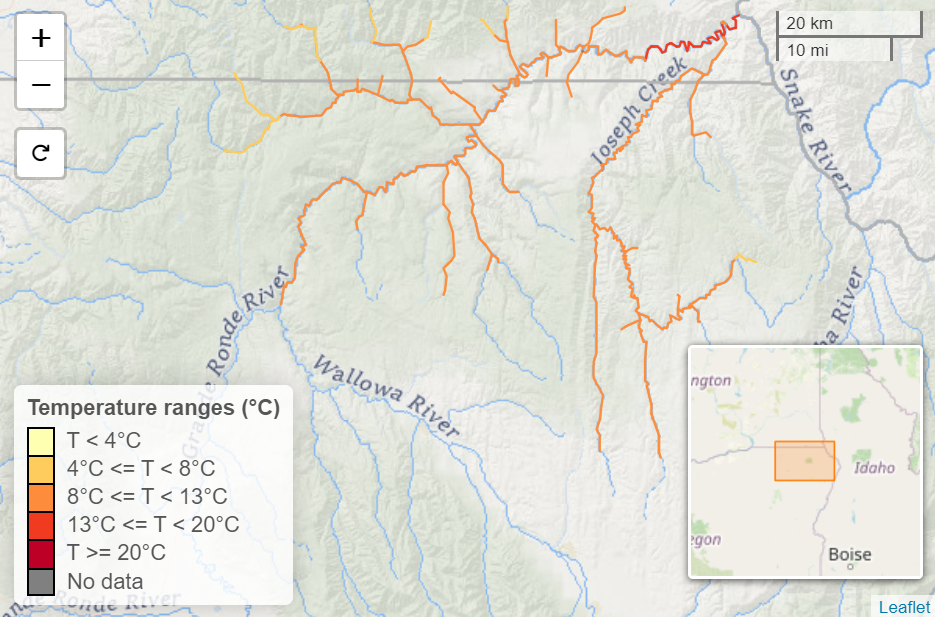
Predicted Stream Temperatures — This online tool (R-Shiny app) provides daily free-flowing stream temperatures in the Pacific Northwest. The temperatures are predicted from a Generalized Additive Model (GAM) framework with publicly available data for the climate and landscape model covariates (Siegel et al. 2023; Northwest Fisheries Science Center, NOAA Fisheries).
Users can access different statistical summaries and data visualizations of the predicted stream temperatures from the different tabs: 1) timeseries, 2) thermal metrics, 3) spatiotemporal heatmap, 4) temperature distributions.
In each query, users can access customized dropdown selections of interest, including the watershed (hydrologic unit code, HUC), years (1990–2020), and periods (weeks or salmonid life stage). Query results include maps with color-coded reaches to accompany the figures of results.
Western US Water Temperature