TDG mortality in the Snake and Columbia River using COMPASS

Historical LWG passageSteelhead and Chinook have different default mortality parameters. After selecting the species, then adjust the parameters as needed.
River Conditions Year

Observed TDG at WQM sites
Modeled WQM TDGDisplay the computed TDG at the WQM stations.

Modeled TDGDisplays the powerhouse and spill TDG separately

Constant TDGInteger values: 100 to 150 only. Other values silently ignored.


 Low exposure mortality rate slopeAdjust the rate at which a small change in TDG leads to increased mortality below the critical threshold and see the functional relationship change in graphs. Out of range values silently corrected.

 High exposure mortality rate slopeAdjust the rate at which a small change in TDG leads to increased mortality above the critical threshold and see the functional relationship change in graphs. Out of range values silently corrected.

 Critical value (>100%) between low and high rates.Adjust this threshold to see the functional relationship change in graphs and affect the TDG model outputs. Out of range values silently corrected.


 Modal fish depth (feet)This number must be lower than the maximum depth. Adjust parameters to see the functional relationship change in graphs and affect the TDG model outputs. Out of range values silently corrected.

 Maximum fish depth (feet)This number must be greater than the modal depth. Adjust parameters to see the functional relationship change in graphs and affect the TDG model outputs. Out of range values silently corrected.

Dams:List of dam sites. Refers to either: a single WQM site downstream of dam, or both spill and powerhouse sides of the dam. Select at least one dam or pool. Multiple sites can be chosen using Ctrl-select.
Pools:List of pool sites. These are in the forebays of dams. Select at least one dam or pool. Multiple sites can be chosen using Ctrl-select.
More informationTDG modeling at each dam is a function of flow, spill fraction, tailrace mixing and entrainment of powerhouse-side water. Each dam has its own calibration. TDG modeling in pools is a mixing and dissipating process that is function of time. Source: CRiSP.1.6 Theory and Calibration. Columbia Basin Research, School of Fishery and Aquatic Sciences, University of Washington, Seattle, WA 98195.

Select Output

This is a lightweight interface to the COMPASS model for evaluating TDG exposure of juvenile salmonids. TDG is input from WQM observations, modeled in COMPASS, or input as a constant by the user. 
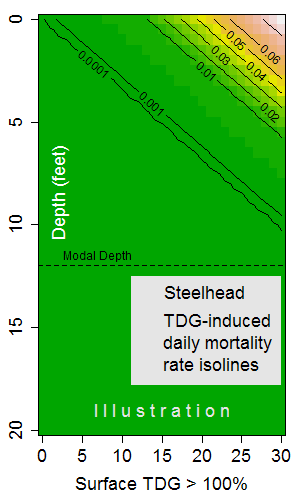
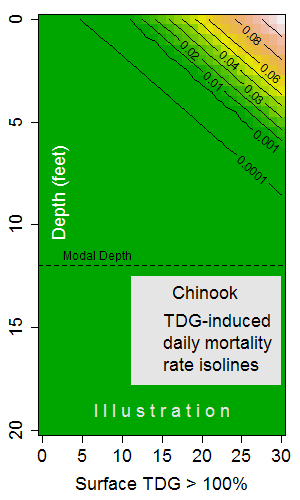
The functional forms of the mortality rate and the fish-depth distribution are also controlled by the user. The effective TDG level that causes gas bubble trauma is a function of depth. Effective TDG declines at 2.96% per foot. Source: Fidler and Miller 1994

TDG modeling at each dam is a function of flow, spill fraction, tailrace mixing and entrainment of powerhouse-side water. Each dam has its own calibration. Source: Method for modeling TDG. In the reservoirs, TDG modeling is a mixing and dissipating process that is function of time. Source: CRiSP.1.6 Theory and Calibration. Columbia Basin Research, School of Fishery and Aquatic Sciences, University of Washington, Seattle, WA 98195.