DART Columbia Basin "Quick Look" ESU and DPS Passage

Data Courtesy of Pacific States Marine Fisheries Commission

Columbia Basin ESU & DPS Passage Queries

Chinook Snake R Spring/Summer ESU 2012 Lower Granite, Little Goose, Lower Monumental, McNary, John Day, Bonneville Chinook Snake R Fall ESU 2012 Lower Granite, Little Goose, Lower Monumental, McNary, John Day, Bonneville Steelhead Snake River DPS 2012 Lower Granite, Little Goose, Lower Monumental, McNary, John Day, Bonneville Sockeye Snake R ESU 2012 Lower Granite, Little Goose, Lower Monumental, McNary, John Day, Bonneville

Last Update: March 23 2023 08:03:11.

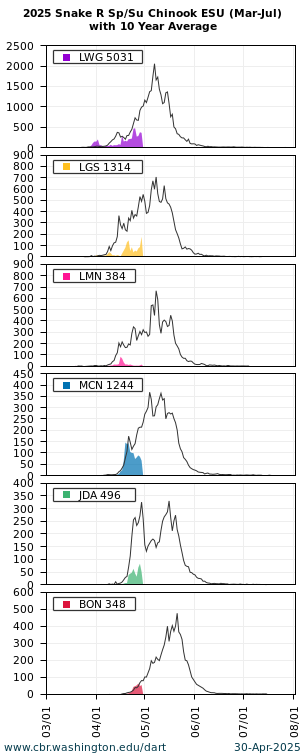
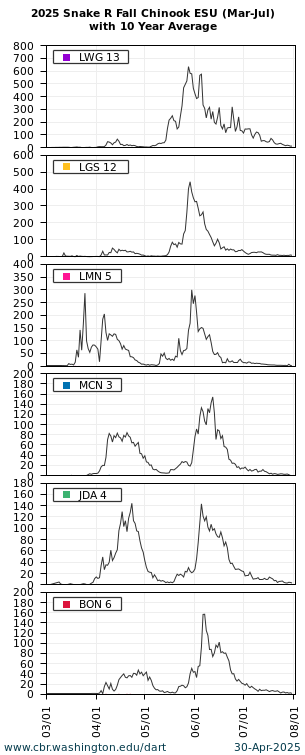
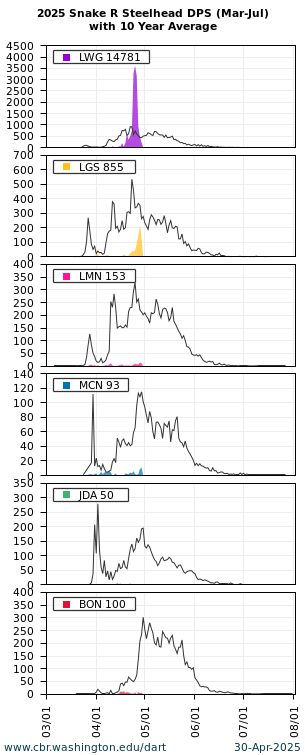
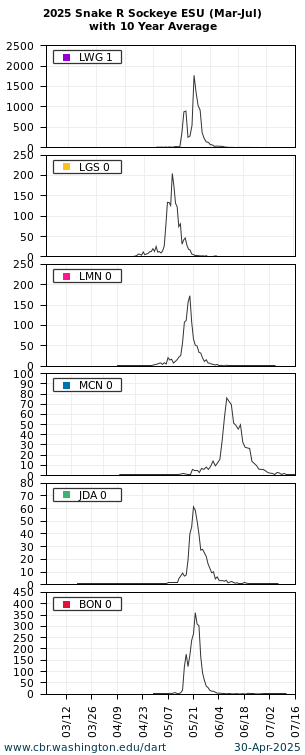
The DART Columbia Basin ESU (Evolutionarily Significant Unit) & DPS (Distinct Population Segment) "Quick Look" Summary presents current passage for select ESU and DPS stocks with the ten year averages at Lower Granite, Little Goose, Lower Monumental, McNary, John Day, and Bonneville dams. Updated daily.

Notes on the DART Columbia Basin ESU/DPS Dataset

DART offers multiple ways to investigate and analyze each specific Columbia Basin ESU (Evolutionarily Significant Unit) and DPS (Distinct Population Segment) population.

  • Graphics&Text: Graphics and Text Output for Multiple Populations, Multiple Years, Multiple Projects with River Environment dataset
  • Quick Look: Presents current Columbia Basin ESU and DPS passage with the ten year averages at Lower Granite, Little Goose, Lower Monumental, McNary, John Day, and Bonneville dams for select ESU/DPS populations. Updated daily.
  • Observation Detail: Table Output of Detailed Release and Observation information for each observed PIT Tag ID for Single Population, Single Year, Single Project with CSV Download File
  • Summary & Migration Timing Component Stocks: HTML Table Output of Daily Observation Totals for Single Year for each component stock (Release Site, Species, Run, and Rear Type) for Single Population, All Projects with migration timing information (10%, 50%, 90%) for each project
  • Mean Travel Times: HTML Table Output of Reach Mean Travel Times for Juvenile and Adult Populations for All Years with Graphs of Reach-Specific Daily Mean Travel Times. The current migration season estimates are updated on a daily basis throughout the season.
  • Historical Run Timing: Graph and HTML Table Output for 10 Year Historical Run Timing for Single Stock, Single Project with Migration Timing Characteristics and Passage Dates