Columbia Basin Conditions All Years for Project

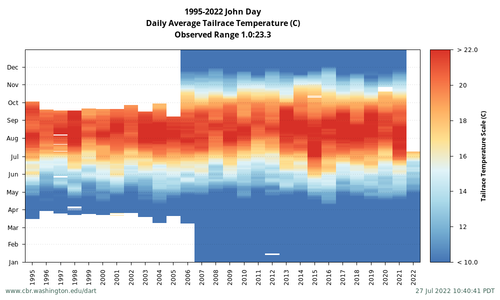
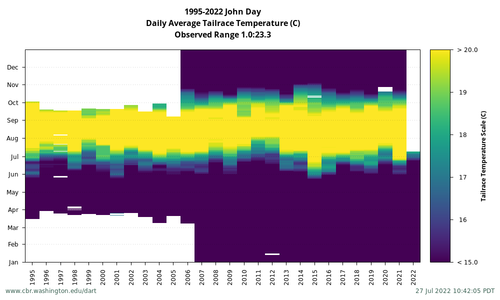
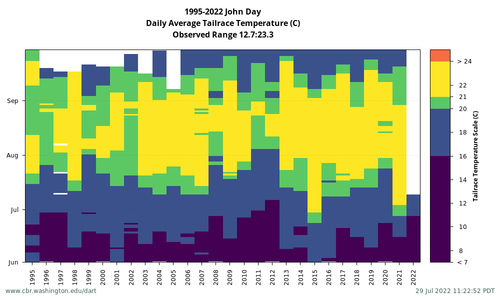
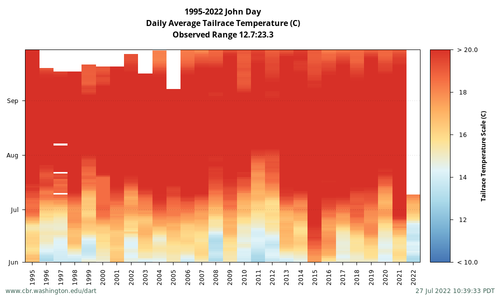
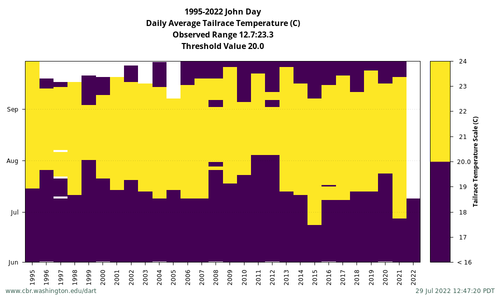
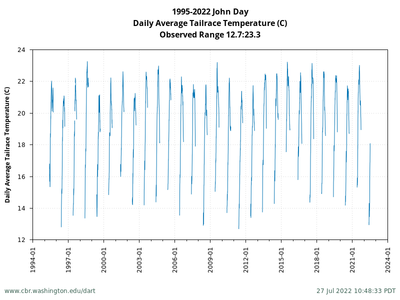
Data Courtesy of U.S. Army Corps of Engineers, NWD and Grant County PUD

Columbia Basin Conditions Queries

Select Location, River Data


Select Output Format

Heatmap Plot

Set Heatmap Scale
Autoscale (to data)
Range Min   Max  (allowed: Min only, Max only, Min<Max)

Select Heatmap Color Palette
Default
Cold->Hotsample image (blue to red) Dry->Wetsample image (brown to blue)
Viridis Palettesample image* (purple to yellow) Plasma Palettesample image* (blue to yellow)
* best for color vision deficiency and B/W printing

Threshold Plot

Set Threshold Value    (2 color plot)

Temperature Biologic (9, 16, 18, 20C) Plot

Temperature Biologic Plus (16, 20, 21, 24C) Plot

Gas Caps (110, 115, 120%) Plot

Gas Caps Plus (110, 115, 120, 125%) Plot

Continuous Line Plot

CSV File

Select Month Range

Start    End

Month range is inclusive. To view only one month, select same month from both menus. Month range does not apply to Continuous Line Plot.


Examples: John Day, Tailrace Temperature
Heatmap Autoscale, Default Palette Heatmap Range Max set, Default Palette, Month Range set Heatmap Range Min<Max set, Viridis Palette
Threshold Plot, Month Range set Temperature Biologic Plus, Month Range set Line Plot